S
Seller's Agent in 2016
Soraya Cacici
Nest Forward
Estimated Value: $403,638 - $438,000
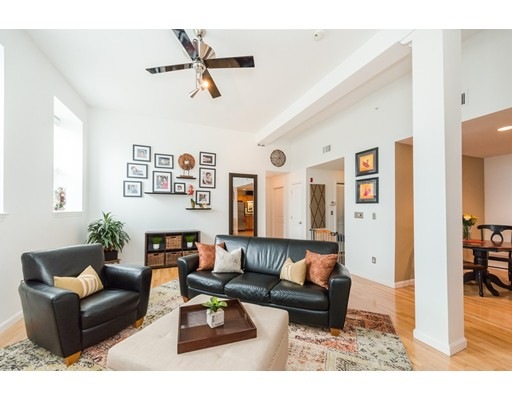
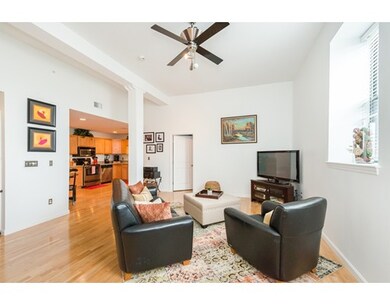
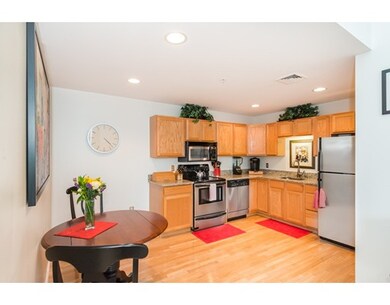
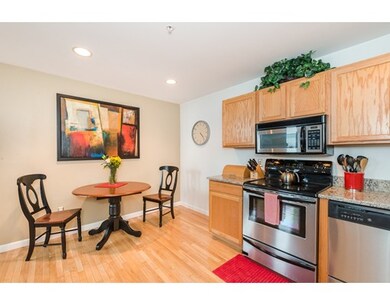
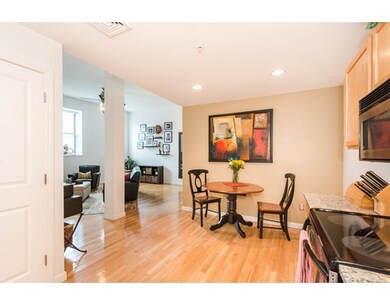
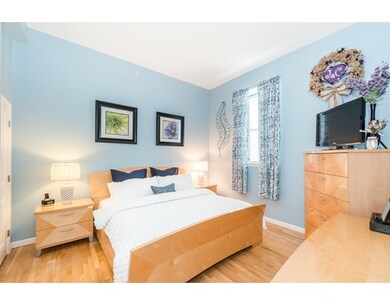
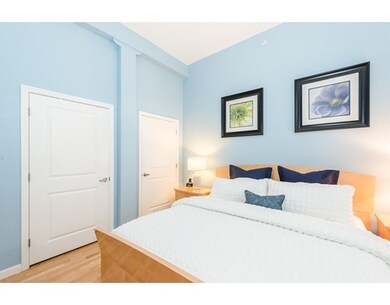
With Boston prices soaring, this vibrant, foot friendly, and community driven neighborhood offers a competitive edge of affordability and livability with a better opportunity for future gain. Governor Baker's economic development team has their eyes on Downtown Lynn, and you should too! Just steps away from the Commuter Rail and a quick walk to beaches, you can live today's active lifestyle while exploring an urban scene with the convenience of everything you need - popular restaurants, shops, pubs, cafes, farmer's market, community garden, grocery stores, theatre, library, museum, stunning architecture, and more! This spacious 2 bedroom condo has it all! Open floor plan, high ceilings, lots of natural light, granite and stainless steel kitchen, bonus office or nursery, pet friendly, off-street parking, in-unit W/D, lots of closet space, and extra storage, all in a well managed building. Investing now in Boston area real estate is predicted to be a solid bet - don't miss out!
Last Agent to Sell the Property
Soraya Cacici
Nest Forward Listed on: 05/03/2016
Last Buyer's Agent
Soraya Cacici
Nest Forward Listed on: 05/03/2016
Home Type
Condominium
Est. Annual Taxes
$3,509
Year Built
1900
Lot Details
0
| Date | Buyer | Sale Price | Title Company |
|---|---|---|---|
| Boliver Brett C | $229,900 | -- | |
| Shelby-Kafalas Megan | $229,900 | -- | |
| Jones Charlene | -- | -- | |
| Jones Charlene | -- | -- | |
| Mandell William M | $275,000 | -- | |
| Mandell William M | $275,000 | -- |
| Date | Status | Borrower | Loan Amount |
|---|---|---|---|
| Open | Boliver Brett C | $209,744 | |
| Closed | Boliver Brett C | $209,744 | |
| Previous Owner | Mandell William M | $204,000 | |
| Previous Owner | Mandell William M | $220,000 |
| Date | Event | Price | Change | Sq Ft Price |
|---|---|---|---|---|
| 06/30/2016 06/30/16 | Sold | $229,900 | 0.0% | $176 / Sq Ft |
| 05/17/2016 05/17/16 | Pending | -- | -- | -- |
| 05/03/2016 05/03/16 | For Sale | $229,900 | -- | $176 / Sq Ft |
| Year | Tax Paid | Tax Assessment Tax Assessment Total Assessment is a certain percentage of the fair market value that is determined by local assessors to be the total taxable value of land and additions on the property. | Land | Improvement |
|---|---|---|---|---|
| 2025 | $3,509 | $338,700 | $0 | $338,700 |
| 2024 | $3,360 | $319,100 | $0 | $319,100 |
| 2023 | $3,343 | $299,800 | $0 | $299,800 |
| 2022 | $3,043 | $244,800 | $0 | $244,800 |
| 2021 | $3,091 | $237,200 | $0 | $237,200 |
| 2020 | $2,988 | $223,000 | $0 | $223,000 |
| 2019 | $2,804 | $196,100 | $0 | $196,100 |
| 2018 | $3,104 | $204,900 | $0 | $204,900 |
| 2017 | $2,817 | $180,600 | $0 | $180,600 |
| 2016 | $2,398 | $148,200 | $0 | $148,200 |
| 2015 | $2,365 | $141,200 | $0 | $141,200 |
S
Seller's Agent in 2016
Soraya Cacici
Nest Forward
Source: MLS Property Information Network (MLS PIN)
MLS Number: 71999057
APN: LYNN-000068-000628-000026-000010-000010
Disclaimer: Certain information contained herein is derived from information provided by parties other than Homes.com. All information provided is deemed reliable, but is not guaranteed to be accurate and should be independently verified.
![]() The property listing data and information, or the Images, set forth herein were provided to MLS Property Information Network, Inc. from third party sources, including sellers, lessors and public records, and were compiled by MLS Property Information Network, Inc. The property listing data and information, and the Images, are for the personal, non-commercial use of consumers having a good faith interest in purchasing or leasing listed properties of the type displayed to them and may not be used for any purpose other than to identify prospective properties which such consumers may have a good faith interest in purchasing or leasing. MLS Property Information Network, Inc. and its subscribers disclaim any and all representations and warranties as to the accuracy of the property listing data and information, or as to the accuracy of any of the Images, set forth herein.
The property listing data and information, or the Images, set forth herein were provided to MLS Property Information Network, Inc. from third party sources, including sellers, lessors and public records, and were compiled by MLS Property Information Network, Inc. The property listing data and information, and the Images, are for the personal, non-commercial use of consumers having a good faith interest in purchasing or leasing listed properties of the type displayed to them and may not be used for any purpose other than to identify prospective properties which such consumers may have a good faith interest in purchasing or leasing. MLS Property Information Network, Inc. and its subscribers disclaim any and all representations and warranties as to the accuracy of the property listing data and information, or as to the accuracy of any of the Images, set forth herein.
