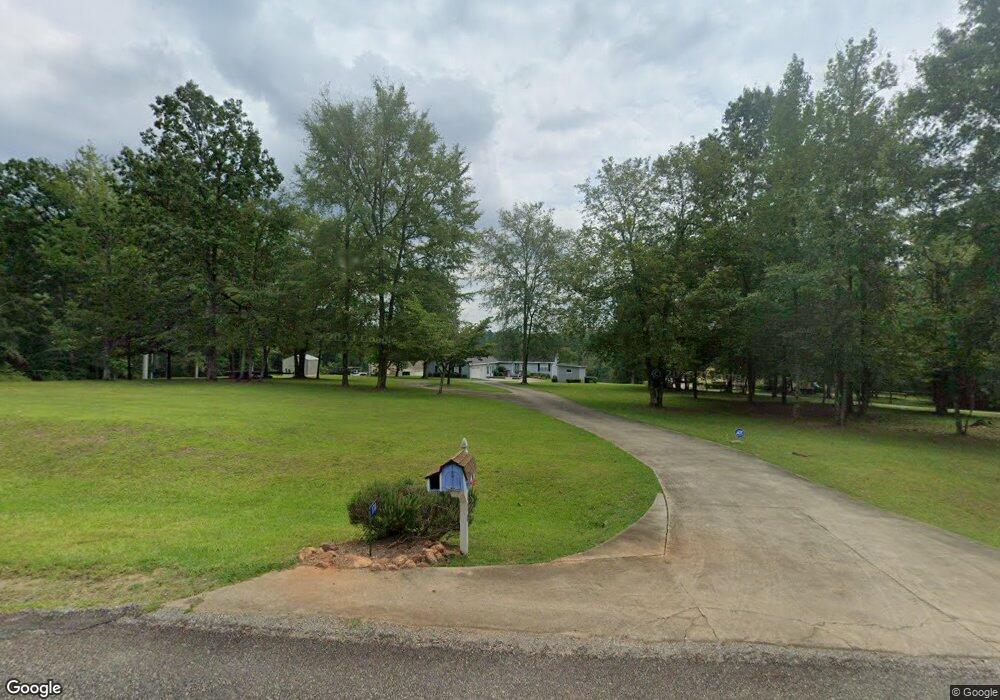
170 Parham Rd NW Milledgeville, GA 31061
Estimated Value: $536,000 - $679,000
3
Beds
2
Baths
2,152
Sq Ft
$289/Sq Ft
Est. Value
About This Home
This home is located at 170 Parham Rd NW, Milledgeville, GA 31061 and is currently estimated at $622,218, approximately $289 per square foot. 170 Parham Rd NW is a home located in Baldwin County with nearby schools including Midway Hills Primary School, Midway Hills Academy, and Oak Hill Middle School.
Ownership History
Date
Name
Owned For
Owner Type
Purchase Details
Closed on
Sep 23, 2013
Sold by
Jump Billy J
Bought by
Jump Billy J and Jump Mary A
Current Estimated Value
Purchase Details
Closed on
Aug 2, 2005
Sold by
Baker Gary R
Bought by
Jump Billy J and Jump Mary A
Purchase Details
Closed on
May 29, 1998
Sold by
Mccrary Nola K
Bought by
Baker Gary R and Baker Tre
Purchase Details
Closed on
Jul 23, 1997
Sold by
Bramlett Family Part
Bought by
Mccrary Nola K
Create a Home Valuation Report for This Property
The Home Valuation Report is an in-depth analysis detailing your home's value as well as a comparison with similar homes in the area
Home Values in the Area
Average Home Value in this Area
Purchase History
| Date | Buyer | Sale Price | Title Company |
|---|---|---|---|
| Jump Billy J | -- | -- | |
| Jump Billy J | $332,000 | -- | |
| Baker Gary R | $150,000 | -- | |
| Mccrary Nola K | $35,000 | -- |
Source: Public Records
Tax History Compared to Growth
Tax History
| Year | Tax Paid | Tax Assessment Tax Assessment Total Assessment is a certain percentage of the fair market value that is determined by local assessors to be the total taxable value of land and additions on the property. | Land | Improvement |
|---|---|---|---|---|
| 2025 | $4,214 | $172,920 | $60,768 | $112,152 |
| 2024 | $4,214 | $172,920 | $60,768 | $112,152 |
| 2023 | $3,350 | $137,480 | $50,640 | $86,840 |
| 2022 | $2,661 | $138,376 | $50,640 | $87,736 |
| 2021 | $2,791 | $117,260 | $50,640 | $66,620 |
| 2020 | $2,675 | $114,224 | $50,640 | $63,584 |
| 2019 | $2,681 | $114,224 | $50,640 | $63,584 |
| 2018 | $2,691 | $114,224 | $50,640 | $63,584 |
| 2017 | $2,658 | $114,224 | $50,640 | $63,584 |
| 2016 | $2,760 | $112,548 | $52,000 | $60,548 |
| 2015 | $2,760 | $112,548 | $52,000 | $60,548 |
| 2014 | $2,759 | $112,548 | $52,000 | $60,548 |
Source: Public Records
Map
Nearby Homes
- 642 Parham Rd NW
- 708 Parham Rd NW
- 673 Parham Rd NW
- 777 Parham Rd NW
- 653 Parham Rd NW
- 155 Honeysuckle Rd NW
- 127 Goodwin Rd NW
- 121 E Montego Ct NW
- 125 Bentley Dr NW
- 340 Thomas Dr
- 344 Thomas Dr
- 148 Bentley Dr NW
- 0 Oak Ln Unit 6920179
- 162 Bentley Dr NW
- 106 Oak Ln
- 204 Thomas Dr
- 110 Thomas Dr
- 130 Thomas Dr
- 160 Parham Rd NW Unit 6
- 160 Parham Rd NW
- 180 Parham Rd NW
- 190 Parham Rd NW
- 140 Parham Rd NW
- 200 Parham Rd NW
- 130 Parham Rd NW
- 161 Parham Rd NW
- 181 Parham Rd NW
- 151 Parham Rd NW
- 210 Parham Rd NW
- 120 Parham Rd NW
- 141 Parham Rd NW
- 220 Parham Rd NW
- 220 Parham Rd NW Unit 12
- 110 Parham Rd NW
- 143 Myrick Rd NW
- 155 Myrick Rd NW
- 24 Parham Rd NW
- 22 Parham Rd NW