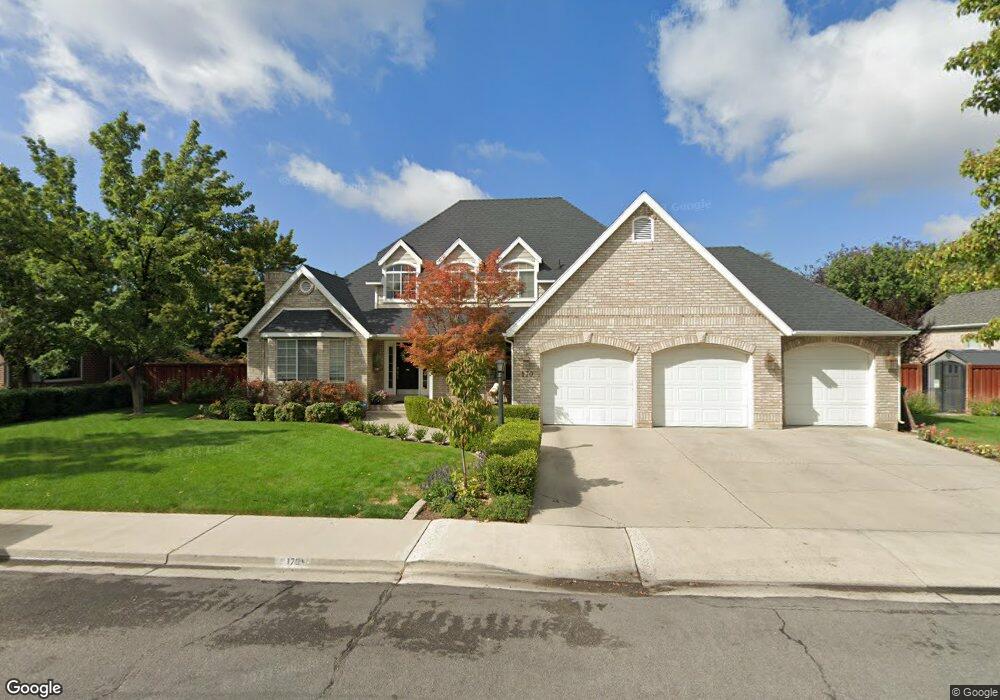
170 S 200 W Orem, UT 84058
Orem Park NeighborhoodEstimated Value: $669,000 - $752,000
3
Beds
3
Baths
2,628
Sq Ft
$267/Sq Ft
Est. Value
About This Home
This home is located at 170 S 200 W, Orem, UT 84058 and is currently estimated at $702,444, approximately $267 per square foot. 170 S 200 W is a home located in Utah County with nearby schools including Orem Elementary School, Orem Junior High School, and Mountain View High School.
Ownership History
Date
Name
Owned For
Owner Type
Purchase Details
Closed on
Aug 30, 2017
Sold by
Francis Christopher S and Francis Saralinda V
Bought by
Gay Angus Rodney and Gay Angus
Current Estimated Value
Purchase Details
Closed on
Aug 10, 2000
Sold by
Kingdon Jamie D
Bought by
Francis Christopher S and Francis Saralinda V
Home Financials for this Owner
Home Financials are based on the most recent Mortgage that was taken out on this home.
Original Mortgage
$215,000
Interest Rate
8.19%
Create a Home Valuation Report for This Property
The Home Valuation Report is an in-depth analysis detailing your home's value as well as a comparison with similar homes in the area
Home Values in the Area
Average Home Value in this Area
Purchase History
| Date | Buyer | Sale Price | Title Company |
|---|---|---|---|
| Gay Angus Rodney | -- | Backman Title Services | |
| Francis Christopher S | -- | Title West Title Co |
Source: Public Records
Mortgage History
| Date | Status | Borrower | Loan Amount |
|---|---|---|---|
| Previous Owner | Francis Christopher S | $215,000 |
Source: Public Records
Tax History
| Year | Tax Paid | Tax Assessment Tax Assessment Total Assessment is a certain percentage of the fair market value that is determined by local assessors to be the total taxable value of land and additions on the property. | Land | Improvement |
|---|---|---|---|---|
| 2025 | $2,949 | $386,155 | -- | -- |
| 2024 | $2,949 | $360,635 | $0 | $0 |
| 2023 | $2,739 | $360,030 | $0 | $0 |
| 2022 | $2,992 | $380,930 | $0 | $0 |
| 2021 | $2,872 | $553,900 | $210,500 | $343,400 |
| 2020 | $2,691 | $510,000 | $183,000 | $327,000 |
| 2019 | $2,566 | $505,800 | $183,000 | $322,800 |
| 2018 | $2,326 | $473,500 | $144,100 | $329,400 |
| 2017 | $2,241 | $226,050 | $0 | $0 |
| 2016 | $2,232 | $207,625 | $0 | $0 |
| 2015 | $2,169 | $190,850 | $0 | $0 |
| 2014 | $2,091 | $183,095 | $0 | $0 |
Source: Public Records
Map
Nearby Homes
Your Personal Tour Guide
Ask me questions while you tour the home.