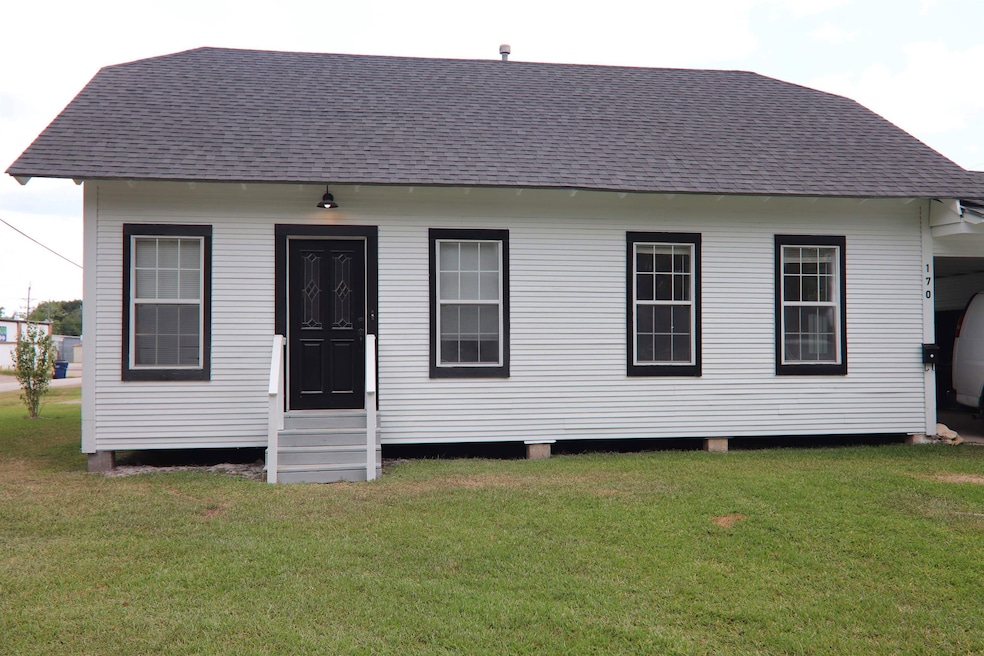
170 S 4th St Unit Carport side of hous Silsbee, TX 77656
Highlights
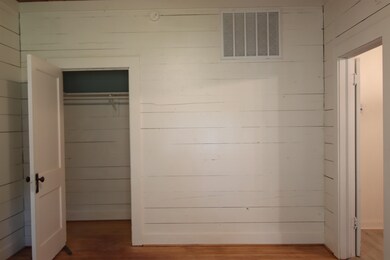
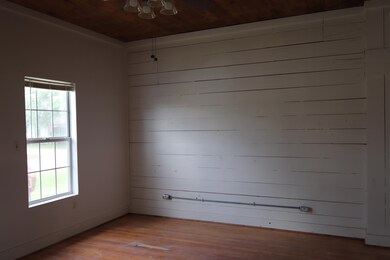
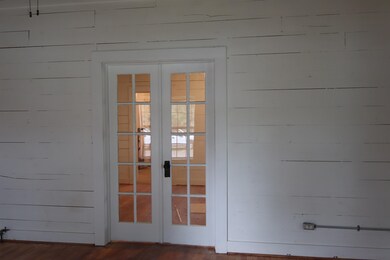
- Wood Flooring
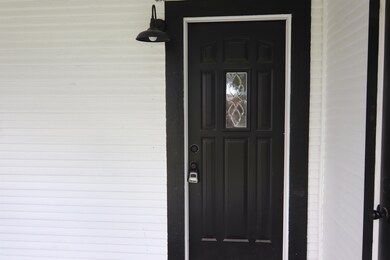
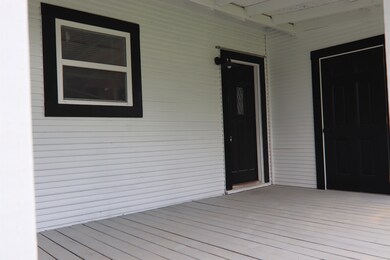
- Covered Patio or Porch
- Living Room
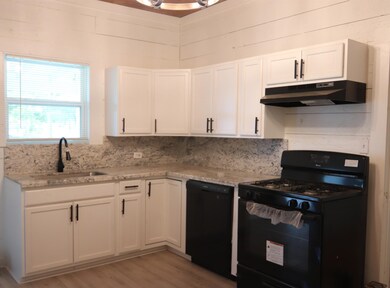
- Granite Countertops
- Double Pane Windows
- Zoned Heating and Cooling
About This Home
What is not to love about this freshly updated original farmhouse cozy 2 bedroom 1 bath 1 car carport duplex. Beautiful original hardwood floors mixed with some updated flooring. Spacious rooms with new windows and lots of natural light. Updated kitchen with granite counter tops. Zoned AC and extra attic insulation for your comfort. 120 SF storage space beside carport.
Property Details
Home Type
- Multi-Family
Est. Annual Taxes
- $2,166
Year Built
- 1938
Lot Details
- Lot Dimensions are 90 x 140
- Chain Link Fence
Parking
- 1 Attached Carport Space
Home Design
- Duplex
- Frame Construction
- Composition Shingle Roof
- Pier And Beam
Interior Spaces
- 1,148 Sq Ft Home
- 1-Story Property
- Ceiling Fan
- Double Pane Windows
- Blinds
- Living Room
- Washer and Dryer Hookup
Kitchen
- Stove
- Ice Maker
- Dishwasher
- Granite Countertops
Flooring
- Wood
- Luxury Vinyl Plank Tile
Bedrooms and Bathrooms
- 2 Bedrooms
- 1 Full Bathroom
Outdoor Features
- Covered Patio or Porch
Utilities
- Zoned Heating and Cooling
- Internet Available
Community Details
- Pets Allowed
- Pet Deposit $500
Listing and Financial Details
- Security Deposit $1,200
- 1 - 3 Year Lease Term
Map
Source: Beaumont Board of REALTORS®
MLS Number: 263521
APN: 004100-013000
Disclaimer: Certain information contained herein is derived from information provided by parties other than Homes.com. All information provided is deemed reliable, but is not guaranteed to be accurate and should be independently verified.
![]() All information provided is deemed reliable but is not guaranteed. Information being provided is for consumers' personal, non-commercial use and may not be used for any purpose other than to identify prospective properties consumers may be interested in purchasing.
All information provided is deemed reliable but is not guaranteed. Information being provided is for consumers' personal, non-commercial use and may not be used for any purpose other than to identify prospective properties consumers may be interested in purchasing.
- 435 E Avenue J
- 605 N 6th St
- 725 S 7th St
- 365 S 12th St
- 695 Grimes Ave
- 121 Seaman Dr
- 2764 Tx-327
- 8464 Andover Dr
- 7949 Louise Ln
- 4062 Fm 92
- 115 Suncrest St
- 120 Greentree St
- 100 Dillons Way
- 6645 Daylily
- 6640 Daylily
- 5670 Shadowbend Cir W Unit 106
- 6620 Tulip
- 6575 Orchid
- 4740 Ariola Ln
- 6655 Daisy Unit 6655 DS
