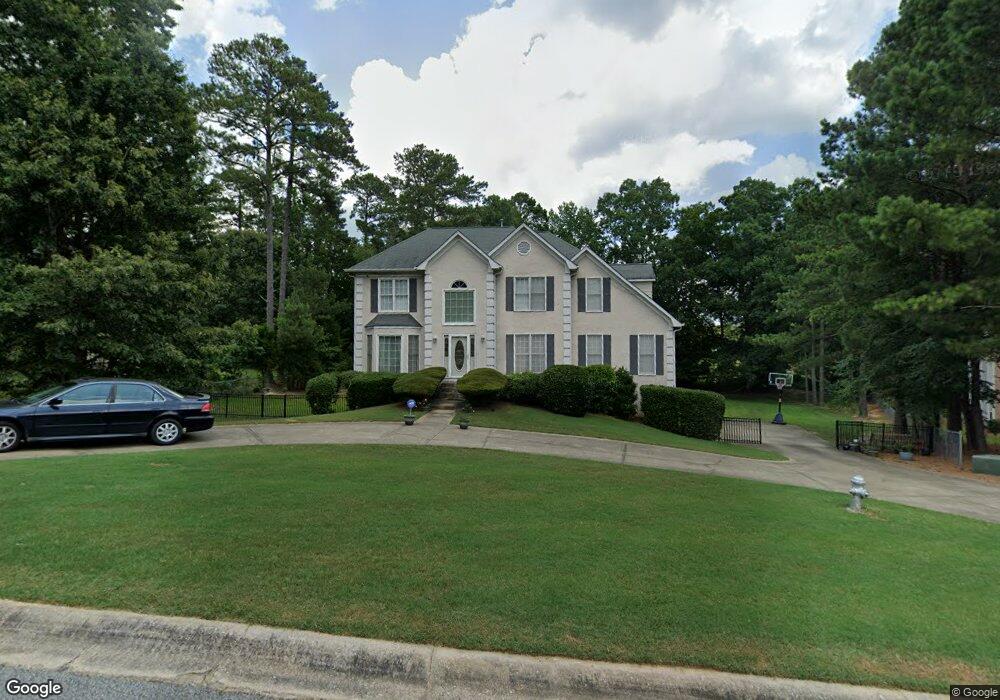
170 Sagamore Ct Fayetteville, GA 30214
Estimated Value: $374,452 - $435,000
--
Bed
1
Bath
2,371
Sq Ft
$171/Sq Ft
Est. Value
About This Home
This home is located at 170 Sagamore Ct, Fayetteville, GA 30214 and is currently estimated at $404,863, approximately $170 per square foot. 170 Sagamore Ct is a home located in Fayette County with nearby schools including North Fayette Elementary School, Flat Rock Middle School, and Sandy Creek High School.
Ownership History
Date
Name
Owned For
Owner Type
Purchase Details
Closed on
Dec 11, 2021
Sold by
Parks Kevin D
Bought by
Parks Kevin D and Parks Candice Latrell
Current Estimated Value
Home Financials for this Owner
Home Financials are based on the most recent Mortgage that was taken out on this home.
Original Mortgage
$240,000
Outstanding Balance
$214,342
Interest Rate
2.98%
Mortgage Type
VA
Estimated Equity
$190,521
Purchase Details
Closed on
May 19, 2017
Sold by
Parks Kevin D
Bought by
Green Parks Kevin D and Green Parks Candice Latrell
Home Financials for this Owner
Home Financials are based on the most recent Mortgage that was taken out on this home.
Original Mortgage
$188,977
Interest Rate
3.97%
Mortgage Type
VA
Purchase Details
Closed on
Nov 3, 1993
Sold by
Stinchcomb Dan V
Bought by
Green Louis
Home Financials for this Owner
Home Financials are based on the most recent Mortgage that was taken out on this home.
Original Mortgage
$111,900
Interest Rate
6.95%
Create a Home Valuation Report for This Property
The Home Valuation Report is an in-depth analysis detailing your home's value as well as a comparison with similar homes in the area
Home Values in the Area
Average Home Value in this Area
Purchase History
| Date | Buyer | Sale Price | Title Company |
|---|---|---|---|
| Parks Kevin D | -- | Law Office Of Edward J Krug | |
| Green Parks Kevin D | -- | -- | |
| Parks Kevin D | $185,000 | -- | |
| Green Louis | $139,900 | -- |
Source: Public Records
Mortgage History
| Date | Status | Borrower | Loan Amount |
|---|---|---|---|
| Open | Parks Kevin D | $240,000 | |
| Previous Owner | Parks Kevin D | $188,977 | |
| Previous Owner | Green Louis | $111,900 |
Source: Public Records
Tax History Compared to Growth
Tax History
| Year | Tax Paid | Tax Assessment Tax Assessment Total Assessment is a certain percentage of the fair market value that is determined by local assessors to be the total taxable value of land and additions on the property. | Land | Improvement |
|---|---|---|---|---|
| 2024 | $2,562 | $119,784 | $15,000 | $104,784 |
| 2023 | $2,149 | $114,680 | $15,000 | $99,680 |
| 2022 | $2,475 | $109,560 | $15,000 | $94,560 |
| 2021 | $2,334 | $94,520 | $15,000 | $79,520 |
| 2020 | $2,463 | $87,400 | $15,000 | $72,400 |
| 2019 | $2,376 | $83,480 | $15,000 | $68,480 |
| 2018 | $2,129 | $74,000 | $14,000 | $60,000 |
| 2017 | $2,280 | $76,160 | $15,000 | $61,160 |
| 2016 | $2,110 | $68,760 | $15,000 | $53,760 |
| 2015 | $2,002 | $63,960 | $15,000 | $48,960 |
| 2014 | $1,838 | $57,680 | $15,000 | $42,680 |
| 2013 | -- | $54,080 | $0 | $0 |
Source: Public Records
Map
Nearby Homes
- 130 W Pier Way
- 120 Gentle Doe Dr
- 178 Westbridge Rd
- 0 Highway 92 Unit 7579300
- 0 Highway 92 Unit 10513871
- 400 Benjamin Cir Unit 3
- 227 Oak Ridge Trail
- 919 Kite Lake Trail
- 405 Fairfield Cir
- 0 Barsi Point
- 280 Benjamin Cir
- 100 Carlyle Ln
- 150 Ashley Dr
- 210 New Oak Ridge Trail
- 849 Wagon Wheel Cir
- 130 Benjamin Cir
- 220 Eastmark Way
- 100 Thornton Ct
- 245 Jewel Bluff
- 313 Wagon Wheel Trail
- 180 Sagamore Ct
- 160 Sagamore Ct
- 185 Sagamore Ct
- 175 Sagamore Ct
- 150 Sagamore Ct Unit II
- 145 Sagamore Ct
- 0 Sagamore Ct Unit 8852711
- 0 Sagamore Ct Unit 8445507
- 0 Sagamore Ct Unit 7150354
- 0 Sagamore Ct Unit 3103274
- 1309 Forrest Ave
- 140 Sagamore Ct
- 1039 New Hope Rd
- 1420 New Hope Rd Unit TRACK 3
- 1410 New Hope Rd Unit TR 1 & 3
- 125 Sagamore Ct
- 12 Lees Mill Rd
- 130 Sagamore Ct
- 110 Dunhill Ct
- 0 LOT Lee's Mill Rd