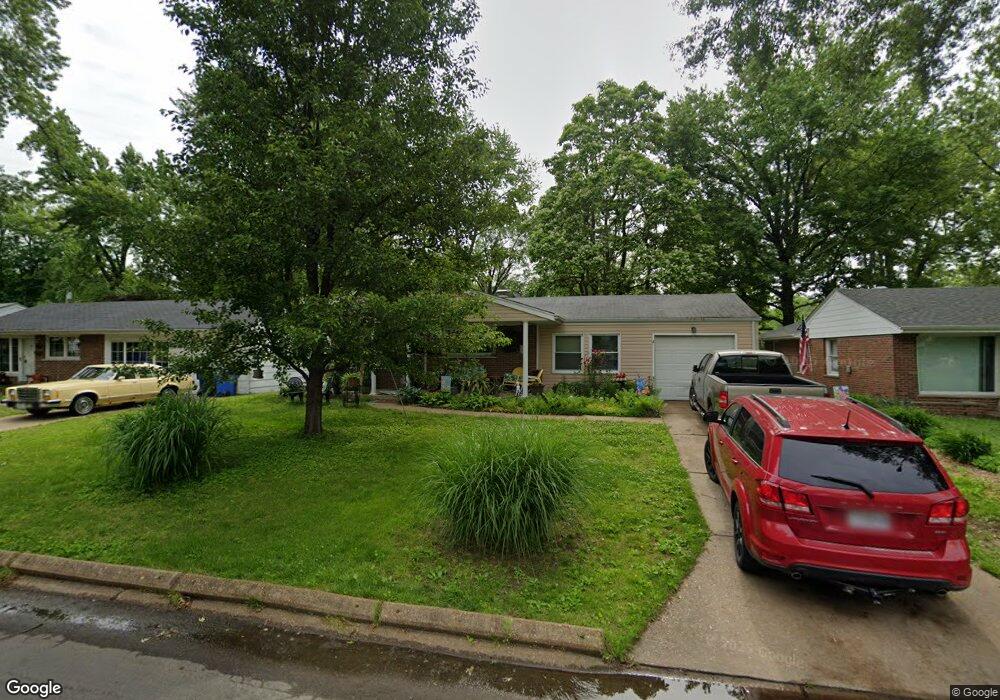
170 Saint Benedict Ln Florissant, MO 63033
Estimated Value: $176,247 - $193,000
3
Beds
3
Baths
1,323
Sq Ft
$140/Sq Ft
Est. Value
About This Home
This home is located at 170 Saint Benedict Ln, Florissant, MO 63033 and is currently estimated at $184,812, approximately $139 per square foot. 170 Saint Benedict Ln is a home located in St. Louis County with nearby schools including Duchesne Elementary School, Cross Keys Middle School, and McCluer North High School.
Ownership History
Date
Name
Owned For
Owner Type
Purchase Details
Closed on
Jun 11, 2009
Sold by
Zaehringer Sandra Jane and Zaehringer Thomas
Bought by
Zaehringer Sandra Jane and Zaehringer Thomas
Current Estimated Value
Home Financials for this Owner
Home Financials are based on the most recent Mortgage that was taken out on this home.
Original Mortgage
$128,974
Outstanding Balance
$81,751
Interest Rate
4.83%
Mortgage Type
FHA
Estimated Equity
$103,061
Purchase Details
Closed on
Dec 20, 2007
Sold by
Anderson Leon David and Anderson Michelle
Bought by
Zaehringer Sandra Jane
Home Financials for this Owner
Home Financials are based on the most recent Mortgage that was taken out on this home.
Original Mortgage
$117,736
Interest Rate
6.07%
Mortgage Type
Stand Alone Refi Refinance Of Original Loan
Purchase Details
Closed on
Dec 2, 2005
Sold by
Anderson Montie L
Bought by
Anderson Leon David and Zaehringer Sandra Jane
Purchase Details
Closed on
Dec 28, 2001
Sold by
Anderson Montie Lee
Bought by
Anderson Leon David and Zaehringer Sandra Jane
Create a Home Valuation Report for This Property
The Home Valuation Report is an in-depth analysis detailing your home's value as well as a comparison with similar homes in the area
Home Values in the Area
Average Home Value in this Area
Purchase History
| Date | Buyer | Sale Price | Title Company |
|---|---|---|---|
| Zaehringer Sandra Jane | -- | None Available | |
| Zaehringer Sandra Jane | $30,000 | Chicago Title | |
| Anderson Leon David | -- | -- | |
| Anderson Leon David | -- | -- |
Source: Public Records
Mortgage History
| Date | Status | Borrower | Loan Amount |
|---|---|---|---|
| Open | Zaehringer Sandra Jane | $128,974 | |
| Closed | Zaehringer Sandra Jane | $117,736 |
Source: Public Records
Tax History Compared to Growth
Tax History
| Year | Tax Paid | Tax Assessment Tax Assessment Total Assessment is a certain percentage of the fair market value that is determined by local assessors to be the total taxable value of land and additions on the property. | Land | Improvement |
|---|---|---|---|---|
| 2025 | $2,198 | $32,080 | $4,850 | $27,230 |
| 2024 | $2,198 | $28,360 | $3,720 | $24,640 |
| 2023 | $2,190 | $28,360 | $3,720 | $24,640 |
| 2022 | $2,041 | $23,230 | $3,720 | $19,510 |
| 2021 | $2,007 | $23,230 | $3,720 | $19,510 |
| 2020 | $1,897 | $20,650 | $3,720 | $16,930 |
| 2019 | $1,860 | $20,650 | $3,720 | $16,930 |
| 2018 | $1,812 | $17,960 | $2,090 | $15,870 |
| 2017 | $1,802 | $17,960 | $2,090 | $15,870 |
| 2016 | $1,813 | $17,610 | $2,470 | $15,140 |
| 2015 | $1,823 | $17,610 | $2,470 | $15,140 |
| 2014 | $1,776 | $17,710 | $3,690 | $14,020 |
Source: Public Records
Map
Nearby Homes
- 2240 Brook Dr
- 505 Ridge Dr
- 1965 Saint Catherine St
- 785 Bobbins Ln
- 750 Robinwood Dr
- 2340 Saint Catherine St
- 12 Country Ln
- 2020 Washington St Unit 707
- 805 Derhake Rd
- 675 Pimlico Dr
- 150 Saint Daniel Ln
- 1030 Robinwood Dr
- 2505 Saint Catherine St
- 765 Pimlico Dr
- 1290 Saint Louis St
- 629 Aubuchon St
- 13 Bayberry Ln
- 1205 Saint Matthew Dr
- 1130 Saint Francois St
- 1040 Bluefield Dr
- 160 Saint Benedict Ln
- 180 Saint Benedict Ln
- 150 Saint Benedict Ln
- 190 Saint Benedict Ln
- 335 Larry Dr
- 325 Larry Dr
- 355 Larry Dr
- 315 Larry Dr
- 140 Saint Benedict Ln
- 165 Saint Benedict Ln
- 155 Saint Benedict Ln
- 365 Larry Dr
- 185 Saint Benedict Ln
- 145 Saint Benedict Ln
- 305 Larry Dr
- 200 Saint Benedict Ln
- 130 Saint Benedict Ln
- 385 Larry Dr
- 135 Saint Benedict Ln
- 210 Saint Benedict Ln