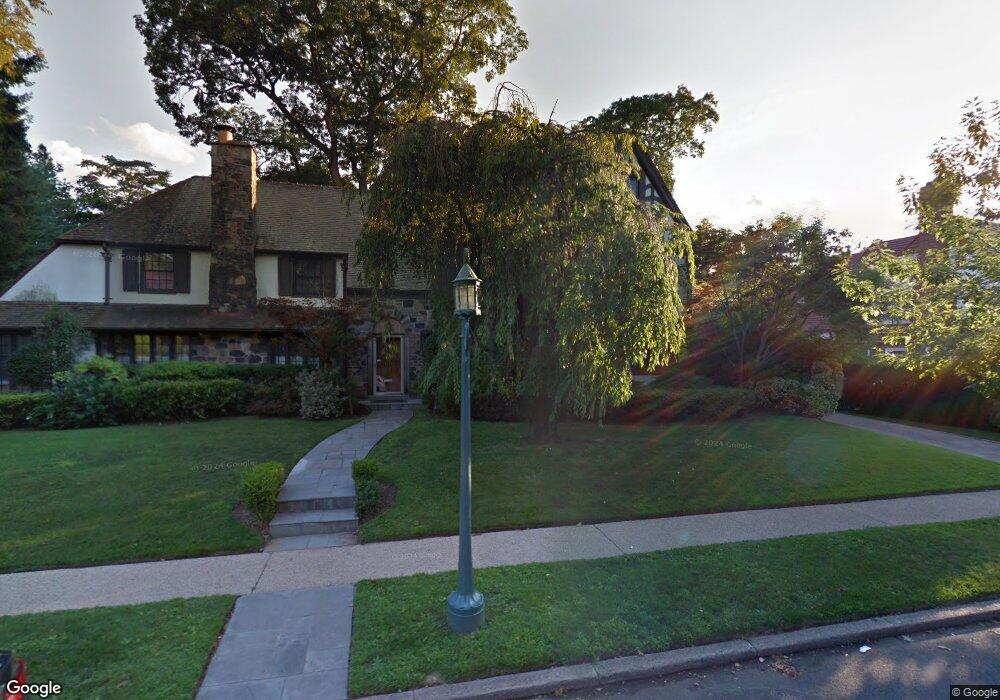
170 Slocum Crescent Forest Hills, NY 11375
Forest Hills NeighborhoodEstimated Value: $2,769,000 - $3,751,000
--
Bed
--
Bath
4,452
Sq Ft
$730/Sq Ft
Est. Value
About This Home
This home is located at 170 Slocum Crescent, Forest Hills, NY 11375 and is currently estimated at $3,249,599, approximately $729 per square foot. 170 Slocum Crescent is a home located in Queens County with nearby schools including Ps 101 School In The Gardens, J.H.S. 190 Russell Sage, and Queens Metropolitan High School.
Ownership History
Date
Name
Owned For
Owner Type
Purchase Details
Closed on
Jul 20, 2010
Sold by
Ting Peter and Ting Shei Fen
Bought by
Ting Peter Keung and Ting Sheifen Sue
Current Estimated Value
Purchase Details
Closed on
Dec 9, 2008
Sold by
Tavdy Esther
Bought by
Ting Peter and Ting Shei Fen
Home Financials for this Owner
Home Financials are based on the most recent Mortgage that was taken out on this home.
Original Mortgage
$600,000
Interest Rate
6.17%
Purchase Details
Closed on
Mar 1, 2005
Sold by
Tavdy David M and Tavdy Esther
Bought by
Tavdy Esther
Purchase Details
Closed on
Jul 2, 2004
Sold by
Naloychenko Anatoly and Naloychenko Baron %
Bought by
Tavdy David M and Tavdy Esther
Purchase Details
Closed on
Sep 1, 1999
Sold by
Nahar Amand and Nahar Ratna
Bought by
Naloychenko Anatoly and Naloychenko Emily
Create a Home Valuation Report for This Property
The Home Valuation Report is an in-depth analysis detailing your home's value as well as a comparison with similar homes in the area
Home Values in the Area
Average Home Value in this Area
Purchase History
| Date | Buyer | Sale Price | Title Company |
|---|---|---|---|
| Ting Peter Keung | -- | -- | |
| Ting Peter Keung | -- | -- | |
| Ting Peter | $3,100,000 | -- | |
| Ting Peter | $3,100,000 | -- | |
| Tavdy Esther | -- | -- | |
| Tavdy Esther | -- | -- | |
| Tavdy David M | $2,250,000 | -- | |
| Tavdy David M | $2,250,000 | -- | |
| Naloychenko Anatoly | $4,550,000 | Ticor Title Insurance Compan | |
| Naloychenko Anatoly | $4,550,000 | Ticor Title Insurance Compan |
Source: Public Records
Mortgage History
| Date | Status | Borrower | Loan Amount |
|---|---|---|---|
| Previous Owner | Ting Peter | $600,000 |
Source: Public Records
Tax History Compared to Growth
Tax History
| Year | Tax Paid | Tax Assessment Tax Assessment Total Assessment is a certain percentage of the fair market value that is determined by local assessors to be the total taxable value of land and additions on the property. | Land | Improvement |
|---|---|---|---|---|
| 2025 | $32,738 | $172,778 | $36,342 | $136,436 |
| 2024 | $32,738 | $162,998 | $34,183 | $128,815 |
| 2023 | $30,885 | $153,772 | $31,964 | $121,808 |
| 2022 | $38,613 | $209,700 | $42,480 | $167,220 |
| 2021 | $38,402 | $185,760 | $42,480 | $143,280 |
| 2020 | $36,518 | $175,860 | $42,480 | $133,380 |
| 2019 | $34,355 | $193,740 | $42,480 | $151,260 |
Source: Public Records
Map
Nearby Homes
- 165 Slocum Crescent
- 7212 Harrow St
- 72-03 Ingram St Unit H0USE
- 20 Continental Ave Unit 1-G
- 20 Continental Ave Unit 6L
- 20 Continental Ave Unit 2R
- 10 Holder Place Unit 5A
- 10 Holder Place Unit 3E
- 1 Station Square Unit 311
- 1 Station Square Unit 315
- 4 Dartmouth St Unit 410
- 4 Dartmouth St Unit 7
- 4 Dartmouth St Unit 24
- 4 Dartmouth St Unit 6
- 72-23 Kessel St
- 6 Burns St Unit 220
- 69-36 Dartmouth St
- 69-55 Kessel St
- 54 Ingram St
- 150 Burns St Unit 1GH
- 40 Olive Place
- 162 Slocum Crescent
- 176 Slocum Crescent
- 50 Olive Place
- 154 Slocum Crescent
- 30 Olive Place
- 152 Slocum Crescent
- 149 Slocum Crescent
- 88 Slocum Crescent
- 60 Olive Place
- 150 Slocum Crescent
- 141 Slocum Crescent
- 169 Slocum Crescent
- 14 Olive Place
- 135 Slocum Crescent
- 66 Olive Place
- 54 Bow St
- 55 Bow St
- 175 Slocum Crescent
- 2 Olive Place