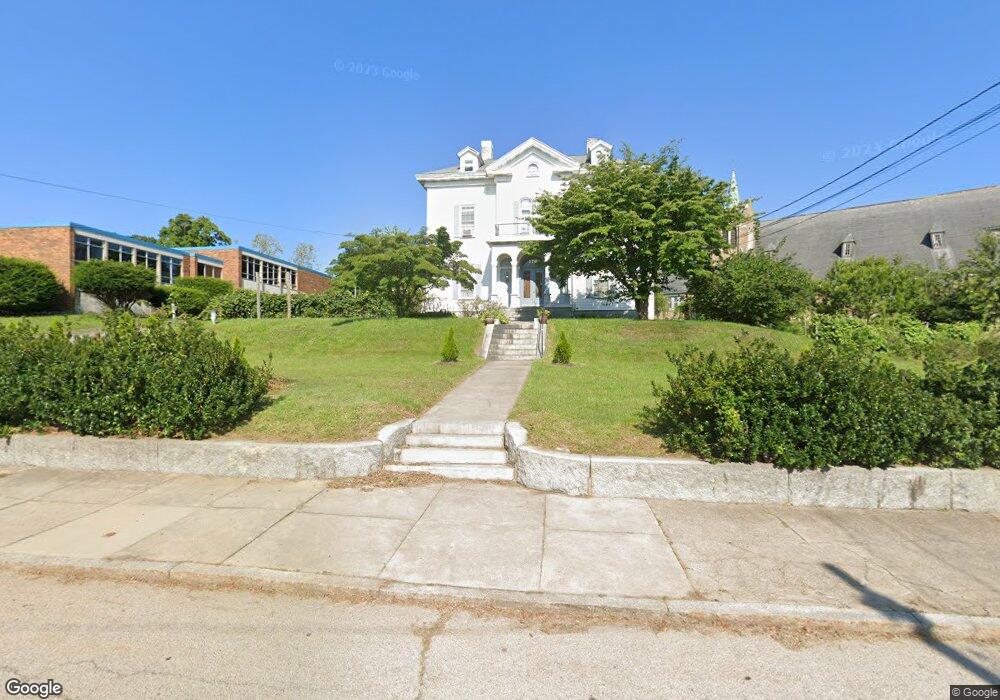
170 Spring St Woonsocket, RI 02895
North End NeighborhoodEstimated Value: $410,000 - $822,000
13
Beds
5
Baths
7,575
Sq Ft
$79/Sq Ft
Est. Value
About This Home
This home is located at 170 Spring St, Woonsocket, RI 02895 and is currently estimated at $596,915, approximately $78 per square foot. 170 Spring St is a home located in Providence County with nearby schools including Woonsocket High School, Rise Prep Mayoral Academy Middle School, and Rise Prep Mayoral Academy.
Ownership History
Date
Name
Owned For
Owner Type
Purchase Details
Closed on
Mar 1, 2010
Sold by
Deutsche Bk
Bought by
Jackson George
Current Estimated Value
Home Financials for this Owner
Home Financials are based on the most recent Mortgage that was taken out on this home.
Original Mortgage
$269,685
Outstanding Balance
$176,370
Interest Rate
5.11%
Mortgage Type
Purchase Money Mortgage
Estimated Equity
$420,545
Create a Home Valuation Report for This Property
The Home Valuation Report is an in-depth analysis detailing your home's value as well as a comparison with similar homes in the area
Home Values in the Area
Average Home Value in this Area
Purchase History
| Date | Buyer | Sale Price | Title Company |
|---|---|---|---|
| Jackson George | $232,000 | -- | |
| Jackson George | $232,000 | -- |
Source: Public Records
Mortgage History
| Date | Status | Borrower | Loan Amount |
|---|---|---|---|
| Open | Jackson George | $269,685 | |
| Closed | Jackson George | $269,685 |
Source: Public Records
Tax History
| Year | Tax Paid | Tax Assessment Tax Assessment Total Assessment is a certain percentage of the fair market value that is determined by local assessors to be the total taxable value of land and additions on the property. | Land | Improvement |
|---|---|---|---|---|
| 2025 | $4,878 | $434,400 | $104,000 | $330,400 |
| 2024 | $8,305 | $571,200 | $100,600 | $470,600 |
| 2023 | $7,985 | $571,200 | $100,600 | $470,600 |
| 2022 | $7,985 | $571,200 | $100,600 | $470,600 |
| 2021 | $9,286 | $391,000 | $65,500 | $325,500 |
| 2020 | $9,384 | $391,000 | $65,500 | $325,500 |
| 2018 | $9,415 | $391,000 | $65,500 | $325,500 |
| 2017 | $11,056 | $367,300 | $59,100 | $308,200 |
| 2016 | $11,695 | $367,300 | $59,100 | $308,200 |
| 2015 | $13,436 | $367,300 | $59,100 | $308,200 |
| 2014 | -- | $345,300 | $65,000 | $280,300 |
Source: Public Records
Map
Nearby Homes
- 164 W School St
- 83 Summer St
- 187 Boyden St
- 107 Blackstone St
- 154 156 Winter St
- 481 N Main St
- 0 N Main St Unit 1401765
- 308 Harris Ave
- 130 E School St
- 458 Prospect St
- 550 Winter St
- 115 Railroad St
- 542 Prospect St
- 36 Fairmount St
- 180 Allen St Unit 104
- 99 Allen St Unit 205
- 60 Fairlawn Ave
- 35 Greene St
- 256 Privilege St
- 42 Elbow St
Your Personal Tour Guide
Ask me questions while you tour the home.