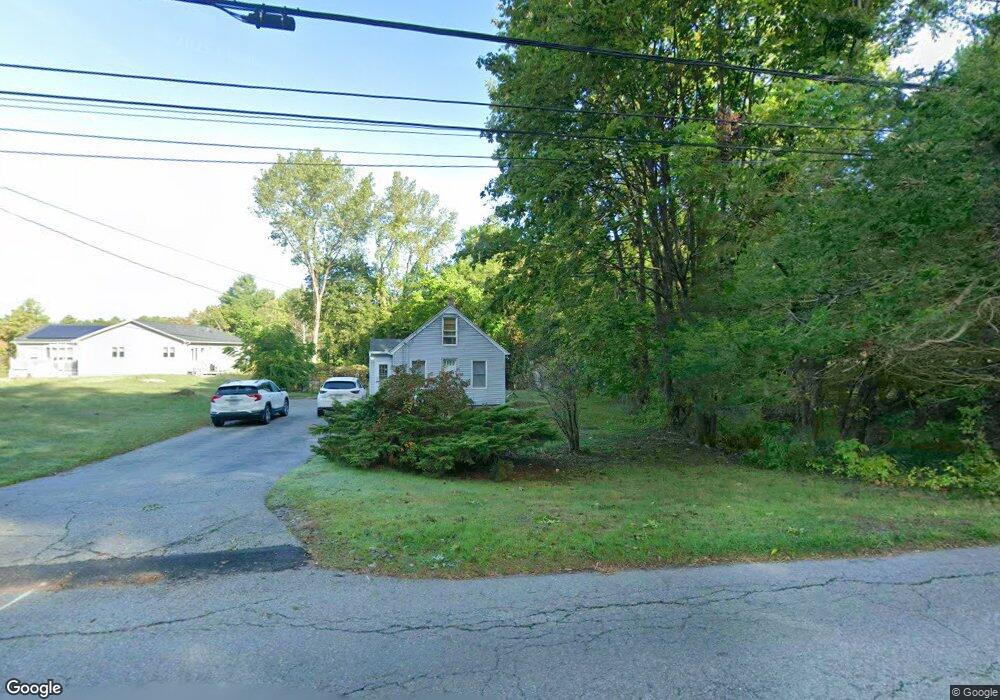
170 Summer St Rehoboth, MA 02769
Estimated Value: $362,000 - $439,000
2
Beds
1
Bath
810
Sq Ft
$484/Sq Ft
Est. Value
About This Home
This home is located at 170 Summer St, Rehoboth, MA 02769 and is currently estimated at $391,861, approximately $483 per square foot. 170 Summer St is a home located in Bristol County with nearby schools including Dighton-Rehoboth Regional High School and Cedar Brook School.
Ownership History
Date
Name
Owned For
Owner Type
Purchase Details
Closed on
May 28, 1999
Sold by
Andrade-Burt Linda and Burt Linda A
Bought by
Bellamy Jeanne M
Current Estimated Value
Home Financials for this Owner
Home Financials are based on the most recent Mortgage that was taken out on this home.
Original Mortgage
$83,000
Interest Rate
6.82%
Mortgage Type
Purchase Money Mortgage
Create a Home Valuation Report for This Property
The Home Valuation Report is an in-depth analysis detailing your home's value as well as a comparison with similar homes in the area
Home Values in the Area
Average Home Value in this Area
Purchase History
| Date | Buyer | Sale Price | Title Company |
|---|---|---|---|
| Bellamy Jeanne M | $87,500 | -- |
Source: Public Records
Mortgage History
| Date | Status | Borrower | Loan Amount |
|---|---|---|---|
| Open | Bellamy Jeanne M | $134,700 | |
| Closed | Bellamy Jeanne M | $96,150 | |
| Closed | Bellamy Jeanne M | $83,000 |
Source: Public Records
Tax History Compared to Growth
Tax History
| Year | Tax Paid | Tax Assessment Tax Assessment Total Assessment is a certain percentage of the fair market value that is determined by local assessors to be the total taxable value of land and additions on the property. | Land | Improvement |
|---|---|---|---|---|
| 2025 | $33 | $297,000 | $163,100 | $133,900 |
| 2024 | $3,146 | $276,900 | $163,100 | $113,800 |
| 2023 | $3,203 | $276,600 | $159,800 | $116,800 |
| 2022 | $3,059 | $241,400 | $152,600 | $88,800 |
| 2021 | $3,008 | $227,200 | $138,400 | $88,800 |
| 2020 | $2,942 | $224,200 | $138,400 | $85,800 |
| 2018 | $0 | $203,700 | $131,900 | $71,800 |
| 2017 | $2,433 | $193,700 | $131,900 | $61,800 |
| 2016 | $2,317 | $190,700 | $131,900 | $58,800 |
| 2015 | $2,451 | $199,100 | $125,600 | $73,500 |
| 2014 | $2,336 | $187,800 | $119,600 | $68,200 |
Source: Public Records
Map
Nearby Homes
- 20 School St
- 111 Summer St
- 0 Winter St
- 67 Wheeler St
- 23 Colonial Way
- 37 Colonial Way
- 198 Brook St
- 6 Running Stream Rd
- 8 Linden Ln
- 8 Linden Ln
- 15 Hickory Ridge Rd
- 63 Moulton St
- 9 Hidden Hills Dr
- 248 County
- 31 Woodland Way
- 205 Providence St Bldr Lot 3
- 203 Providence St Bldr Lot 5
- 206 Moulton St
- 42 Linden Ln
- 25 Lincoln St