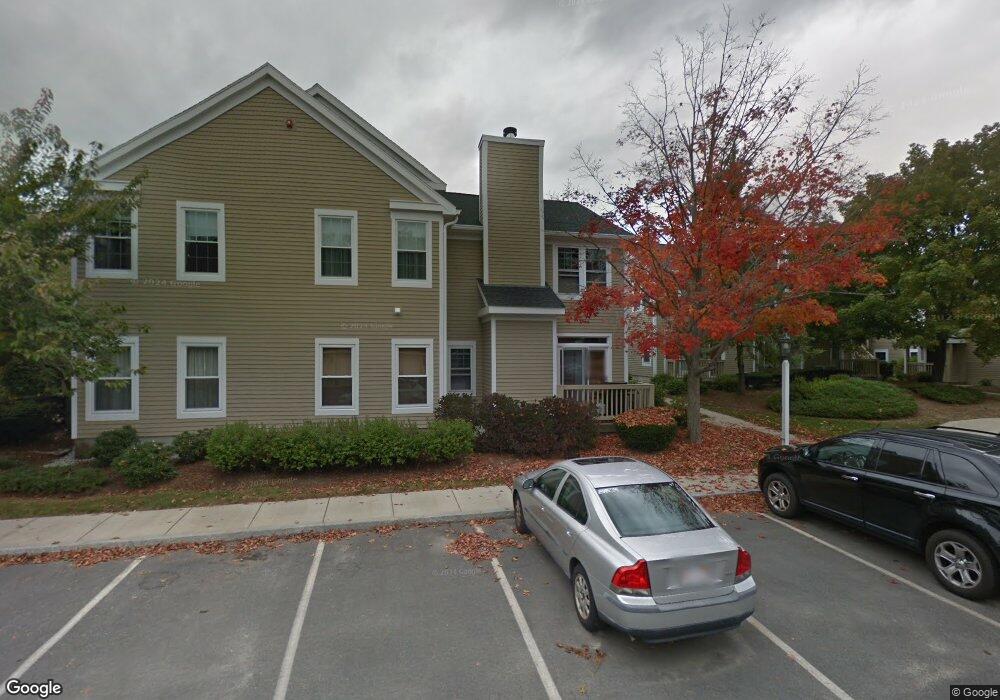
170 Tyson Commons Ln Braintree, MA 02184
South Braintree NeighborhoodEstimated Value: $541,690 - $556,000
3
Beds
2
Baths
1,354
Sq Ft
$406/Sq Ft
Est. Value
About This Home
This home is located at 170 Tyson Commons Ln, Braintree, MA 02184 and is currently estimated at $550,173, approximately $406 per square foot. 170 Tyson Commons Ln is a home located in Norfolk County with nearby schools including Braintree High School, First Baptist Christian School, and CATS Academy Boston.
Ownership History
Date
Name
Owned For
Owner Type
Purchase Details
Closed on
Mar 31, 2023
Sold by
Anderson Patricia C
Bought by
Pc Anderson Irt Hm T
Current Estimated Value
Purchase Details
Closed on
Jun 14, 2016
Sold by
Howard J Pransky
Bought by
Anderson Patricia
Home Financials for this Owner
Home Financials are based on the most recent Mortgage that was taken out on this home.
Original Mortgage
$50,000
Interest Rate
3.6%
Purchase Details
Closed on
Mar 24, 2016
Sold by
Pransky Ft
Bought by
Anderson Patricia
Purchase Details
Closed on
Oct 7, 2011
Sold by
Pransky Sidney L and Pransky Ann
Bought by
Pransky Ft and Pransky Howard J
Purchase Details
Closed on
Sep 3, 1993
Sold by
Wolfe William M
Bought by
Pransky Sidney L and Pransky Ann
Create a Home Valuation Report for This Property
The Home Valuation Report is an in-depth analysis detailing your home's value as well as a comparison with similar homes in the area
Home Values in the Area
Average Home Value in this Area
Purchase History
| Date | Buyer | Sale Price | Title Company |
|---|---|---|---|
| Pc Anderson Irt Hm T | -- | None Available | |
| Anderson Patricia | -- | -- | |
| Anderson Patricia | $340,000 | -- | |
| Pransky Ft | -- | -- | |
| Pransky Sidney L | $136,000 | -- |
Source: Public Records
Mortgage History
| Date | Status | Borrower | Loan Amount |
|---|---|---|---|
| Previous Owner | Pransky Sidney L | $50,000 | |
| Previous Owner | Pransky Sidney L | -- |
Source: Public Records
Tax History
| Year | Tax Paid | Tax Assessment Tax Assessment Total Assessment is a certain percentage of the fair market value that is determined by local assessors to be the total taxable value of land and additions on the property. | Land | Improvement |
|---|---|---|---|---|
| 2025 | $4,816 | $482,600 | $0 | $482,600 |
| 2024 | $4,300 | $453,600 | $0 | $453,600 |
| 2023 | $3,830 | $392,400 | $0 | $392,400 |
| 2022 | $3,631 | $364,900 | $0 | $364,900 |
| 2021 | $3,631 | $364,900 | $0 | $364,900 |
| 2020 | $3,450 | $349,900 | $0 | $349,900 |
| 2019 | $3,382 | $335,200 | $0 | $335,200 |
| 2018 | $3,255 | $308,800 | $0 | $308,800 |
| 2017 | $3,199 | $297,900 | $0 | $297,900 |
| 2016 | $3,032 | $276,100 | $0 | $276,100 |
| 2015 | $2,949 | $266,400 | $0 | $266,400 |
| 2014 | $2,874 | $251,700 | $0 | $251,700 |
Source: Public Records
Map
Nearby Homes
- 169 Tyson Commons Ln
- 55 Bradford Commons Ln Unit 55
- 365 Tilden Commons Ln Unit 365
- 257 Allerton Commons Ln
- 278 Allerton Commons Ln
- 129 Albee Dr
- 1 Geraldine Ln
- 154 Birch St
- 441 Grove St
- 92 Mercury St
- 432 Grove St
- 9 Amherst Rd
- 1696 Liberty St
- 300 West St
- 23 Portland Rd
- 220 Weymouth St
- 24 Evelyn Ln
- 46 Great Pond Rd
- 2 Lakewood Rd
- 30 Donna Rd
- 180 Tyson Commons Ln
- 179 Tyson Commons Ln
- 178 Tyson Commons Ln
- 177 Tyson Commons Ln
- 176 Tyson Commons Ln
- 174 Tyson Commons Ln
- 173 Tyson Commons Ln
- 172 Tyson Commons Ln
- 171 Tyson Commons Ln
- 168 Tyson Commons Ln
- 167 Tyson Commons Ln
- 166 Tyson Commons Ln
- 165 Tyson Commons Ln
- 164 Tyson Commons Ln
- 163 Tyson Commons Ln
- 162 Tyson Commons Ln
- 161 Tyson Commons Ln
- 160 Tyson Commons Ln
- 159 Tyson Commons Ln
- 158 Tyson Commons Ln
Your Personal Tour Guide
Ask me questions while you tour the home.