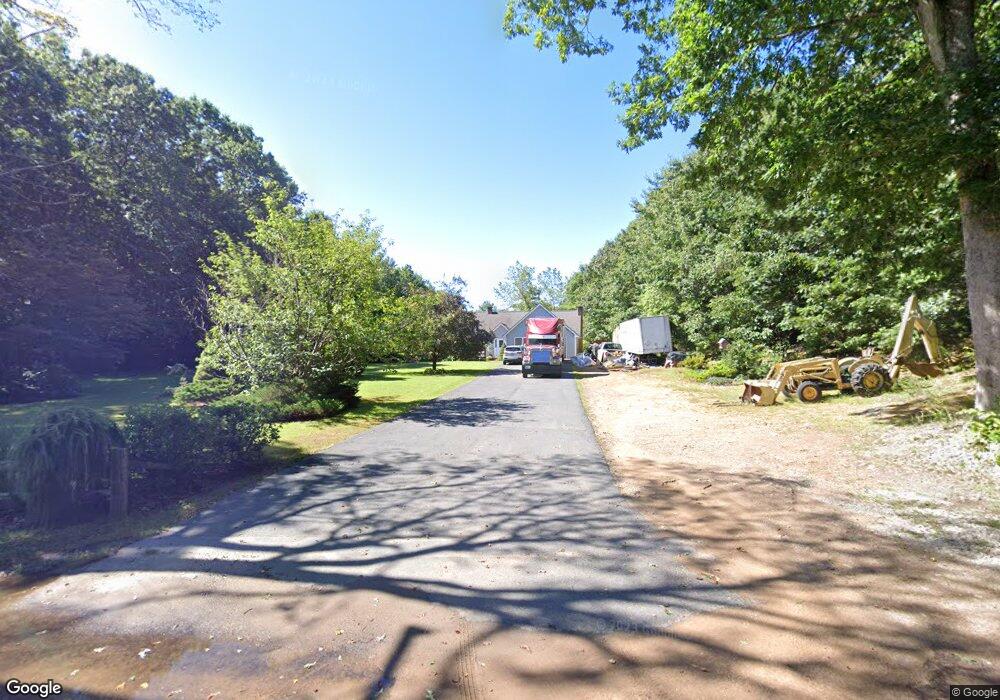
170 Union Rd Wales, MA 01081
Wales NeighborhoodEstimated Value: $481,000 - $888,000
3
Beds
3
Baths
2,330
Sq Ft
$267/Sq Ft
Est. Value
About This Home
This home is located at 170 Union Rd, Wales, MA 01081 and is currently estimated at $622,409, approximately $267 per square foot. 170 Union Rd is a home located in Hampden County with nearby schools including Wales Elementary School, Tantasqua Regional Junior High School, and Tantasqua Regional High School.
Ownership History
Date
Name
Owned For
Owner Type
Purchase Details
Closed on
Oct 24, 1997
Sold by
Page Donna L and Russell Herbert H
Bought by
Reynolds-Joffe Deborah
Current Estimated Value
Home Financials for this Owner
Home Financials are based on the most recent Mortgage that was taken out on this home.
Original Mortgage
$135,000
Outstanding Balance
$21,746
Interest Rate
7.48%
Mortgage Type
Purchase Money Mortgage
Estimated Equity
$600,663
Create a Home Valuation Report for This Property
The Home Valuation Report is an in-depth analysis detailing your home's value as well as a comparison with similar homes in the area
Home Values in the Area
Average Home Value in this Area
Purchase History
| Date | Buyer | Sale Price | Title Company |
|---|---|---|---|
| Reynolds-Joffe Deborah | $165,000 | -- |
Source: Public Records
Mortgage History
| Date | Status | Borrower | Loan Amount |
|---|---|---|---|
| Open | Reynolds-Joffe Deborah | $135,000 | |
| Previous Owner | Reynolds-Joffe Deborah | $75,000 |
Source: Public Records
Tax History
| Year | Tax Paid | Tax Assessment Tax Assessment Total Assessment is a certain percentage of the fair market value that is determined by local assessors to be the total taxable value of land and additions on the property. | Land | Improvement |
|---|---|---|---|---|
| 2025 | $7,164 | $496,800 | $54,800 | $442,000 |
| 2024 | $6,982 | $472,700 | $52,100 | $420,600 |
| 2023 | $6,440 | $377,500 | $45,600 | $331,900 |
| 2022 | $6,197 | $334,600 | $45,600 | $289,000 |
| 2021 | $5,846 | $288,100 | $45,600 | $242,500 |
| 2020 | $5,572 | $288,100 | $45,600 | $242,500 |
| 2019 | $5,269 | $288,100 | $45,600 | $242,500 |
| 2018 | $4,801 | $269,100 | $42,500 | $226,600 |
| 2017 | $4,685 | $269,100 | $42,500 | $226,600 |
| 2016 | $4,971 | $268,000 | $42,500 | $225,500 |
| 2015 | $4,309 | $244,700 | $42,500 | $202,200 |
Source: Public Records
Map
Nearby Homes
- 198 Union Rd
- 88 Stafford Holland Rd
- 514 Old County Rd
- 441 Stickney Hill Rd
- 46 Dogwood Ln
- 10 Church St
- 145 Main St
- 151 Wales Rd
- 7 Hisgen Rd
- 64 Mashapaug Rd
- 2 Farrar Dr
- 15 Cherokee Rd
- Lot 0 Mashapaug Rd (Es)
- 0 E Brimfield Rd
- 178 Brimfield Rd
- 178 Wales Rd
- 6 Kimball Hill Rd
- 425 Stickney Hill Rd
- 118 Lake Shore Blvd
- Lot B Paige Hill Rd
Your Personal Tour Guide
Ask me questions while you tour the home.