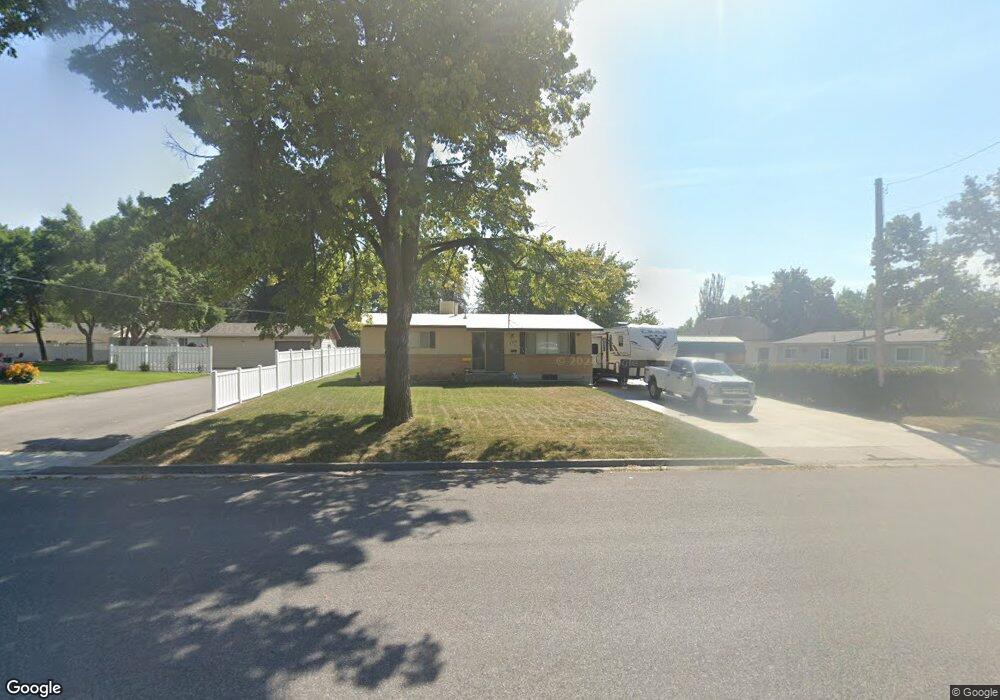
170 W 200 N Smithfield, UT 84335
Estimated Value: $366,000 - $386,000
4
Beds
2
Baths
2,026
Sq Ft
$186/Sq Ft
Est. Value
About This Home
This home is located at 170 W 200 N, Smithfield, UT 84335 and is currently estimated at $377,212, approximately $186 per square foot. 170 W 200 N is a home located in Cache County with nearby schools including Summit School, North Cache Middle School, and White Pine Middle School.
Ownership History
Date
Name
Owned For
Owner Type
Purchase Details
Closed on
Sep 29, 2023
Sold by
Alder Zane G and Alder Lisa K
Bought by
Alder Living Trust and Alder
Current Estimated Value
Purchase Details
Closed on
Aug 3, 2006
Sold by
Friedli Joseph Martin and Friedli Joseph M
Bought by
Alder Zane G and Alder Lisa K
Home Financials for this Owner
Home Financials are based on the most recent Mortgage that was taken out on this home.
Original Mortgage
$24,400
Interest Rate
6.76%
Mortgage Type
Stand Alone Second
Create a Home Valuation Report for This Property
The Home Valuation Report is an in-depth analysis detailing your home's value as well as a comparison with similar homes in the area
Home Values in the Area
Average Home Value in this Area
Purchase History
| Date | Buyer | Sale Price | Title Company |
|---|---|---|---|
| Alder Living Trust | -- | None Listed On Document | |
| Alder Zane G | -- | Advanced Title |
Source: Public Records
Mortgage History
| Date | Status | Borrower | Loan Amount |
|---|---|---|---|
| Previous Owner | Alder Zane G | $24,400 | |
| Previous Owner | Alder Zane G | $97,600 |
Source: Public Records
Tax History Compared to Growth
Tax History
| Year | Tax Paid | Tax Assessment Tax Assessment Total Assessment is a certain percentage of the fair market value that is determined by local assessors to be the total taxable value of land and additions on the property. | Land | Improvement |
|---|---|---|---|---|
| 2025 | $1,341 | $179,580 | $0 | $0 |
| 2024 | $1,405 | $176,410 | $0 | $0 |
| 2023 | $1,465 | $173,945 | $0 | $0 |
| 2022 | $1,489 | $173,945 | $0 | $0 |
| 2021 | $1,452 | $259,200 | $69,000 | $190,200 |
| 2020 | $1,366 | $227,500 | $69,000 | $158,500 |
| 2019 | $1,087 | $172,495 | $44,300 | $128,195 |
| 2018 | $996 | $152,940 | $44,300 | $108,640 |
| 2017 | $927 | $77,715 | $0 | $0 |
| 2016 | $943 | $77,715 | $0 | $0 |
| 2015 | $947 | $77,715 | $0 | $0 |
| 2014 | $841 | $70,390 | $0 | $0 |
| 2013 | -- | $70,390 | $0 | $0 |
Source: Public Records
Map
Nearby Homes
- 212 W 510 N
- 292 W 370 N
- 229 N Main St
- 75 N 300 W
- 423 N 200 W
- 134 W Center St
- 231 W 550 N
- 347 W Center St
- 447 Wasatch Blvd
- 182 W 510 N
- 282 W 510 N
- Hawthorn Townhomes Unit B Plan at Golden Forest - Golden Forest Townhomes
- Princeton Plan at Golden Forest - Golden Forest Single Family
- Fairview Plan at Golden Forest - Golden Forest Single Family
- Richmond Plan at Golden Forest - Golden Forest Single Family
- Ashland Plan at Golden Forest - Golden Forest Single Family
- Magnolia Plan at Golden Forest - Golden Forest Single Family
- Athens Plan at Golden Forest - Golden Forest Single Family
- Madison Plan at Golden Forest - Golden Forest Single Family
- Highland Plan at Golden Forest - Golden Forest Single Family