Estimated Value: $441,000 - $507,000
--
Bed
--
Bath
2,198
Sq Ft
$215/Sq Ft
Est. Value
About This Home
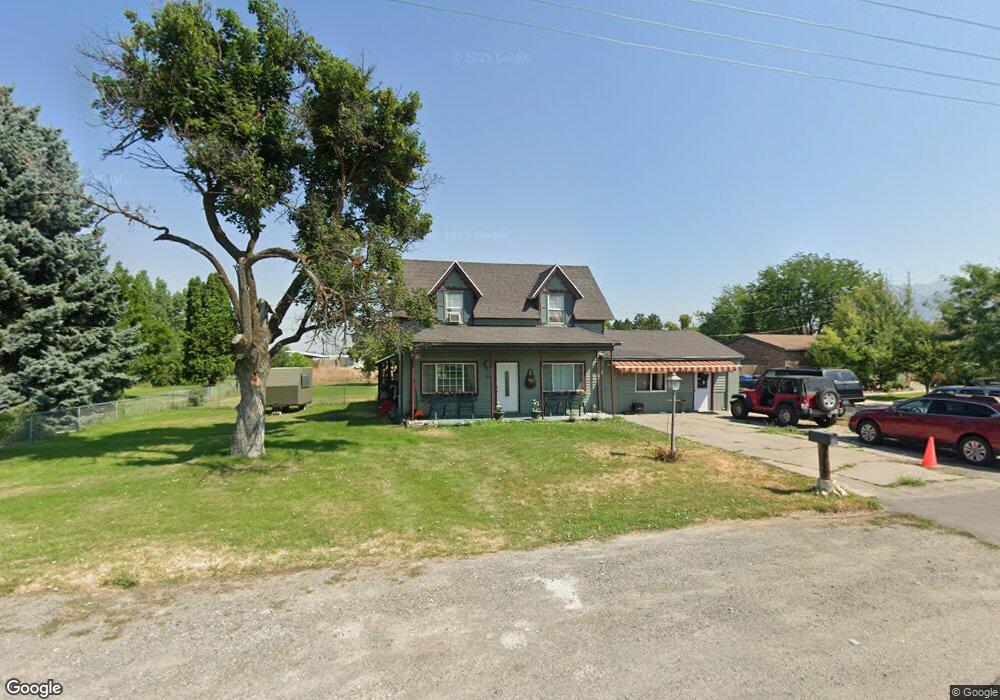
This home is located at 170 W 300 N, Hyrum, UT 84319 and is currently estimated at $472,371, approximately $214 per square foot. 170 W 300 N is a home with nearby schools including Lincoln School, South Cache Middle School, and Mountain Crest High School.
Ownership History
Date
Name
Owned For
Owner Type
Purchase Details
Closed on
Oct 26, 2022
Sold by
Stelor Llc
Bought by
Parkinson Steven
Current Estimated Value
Purchase Details
Closed on
Aug 31, 2022
Sold by
Ronald And Carol Benefiel Living Trust
Bought by
Stelor Llc
Purchase Details
Closed on
Jan 19, 2021
Sold by
Benefiel Ronald L and Benefiel Carol J
Bought by
Benefiel Ronald and Benefiel Carol
Create a Home Valuation Report for This Property
The Home Valuation Report is an in-depth analysis detailing your home's value as well as a comparison with similar homes in the area
Home Values in the Area
Average Home Value in this Area
Purchase History
| Date | Buyer | Sale Price | Title Company |
|---|---|---|---|
| Parkinson Steven | -- | -- | |
| Stelor Llc | -- | -- | |
| Benefiel Ronald | -- | Accommodation |
Source: Public Records
Tax History Compared to Growth
Tax History
| Year | Tax Paid | Tax Assessment Tax Assessment Total Assessment is a certain percentage of the fair market value that is determined by local assessors to be the total taxable value of land and additions on the property. | Land | Improvement |
|---|---|---|---|---|
| 2025 | $1,648 | $236,680 | $0 | $0 |
| 2024 | $1,759 | $235,860 | $0 | $0 |
| 2023 | $1,545 | $198,045 | $0 | $0 |
| 2022 | $1,629 | $200,100 | $0 | $0 |
| 2021 | $1,530 | $289,700 | $77,930 | $211,770 |
| 2020 | $1,356 | $240,830 | $77,930 | $162,900 |
| 2019 | $1,345 | $224,700 | $61,800 | $162,900 |
| 2018 | $1,003 | $162,040 | $61,800 | $100,240 |
| 2017 | $993 | $83,215 | $0 | $0 |
| 2016 | $1,015 | $83,215 | $0 | $0 |
| 2015 | $1,018 | $83,215 | $0 | $0 |
| 2014 | $993 | $83,045 | $0 | $0 |
| 2013 | -- | $69,705 | $0 | $0 |
Source: Public Records
Map
Nearby Homes