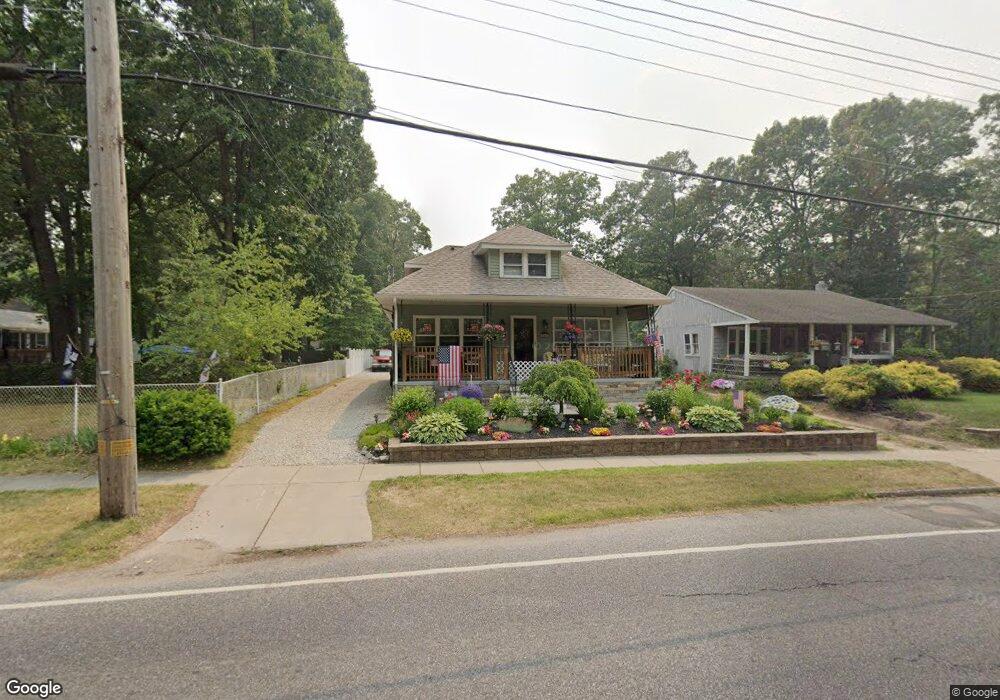
170 W Branch Ave Pine Hill, NJ 08021
Estimated Value: $259,000 - $316,000
3
Beds
1
Bath
1,314
Sq Ft
$216/Sq Ft
Est. Value
About This Home
This home is located at 170 W Branch Ave, Pine Hill, NJ 08021 and is currently estimated at $283,495, approximately $215 per square foot. 170 W Branch Ave is a home located in Camden County with nearby schools including Albert M. Bean Elementary School, Cambridge Middle School, and Pine Hill Middle School.
Ownership History
Date
Name
Owned For
Owner Type
Purchase Details
Closed on
Jan 13, 2025
Sold by
Campbell George
Bought by
Campbell George and Adolfsen Teresa Jo
Current Estimated Value
Purchase Details
Closed on
Feb 12, 2009
Sold by
Hud
Bought by
Campbell George
Purchase Details
Closed on
Jun 6, 2008
Sold by
Wright Daniel P and Wright Cheryl
Bought by
Hud
Purchase Details
Closed on
Jun 25, 2004
Sold by
Njhr 2 Llc
Bought by
Wright Daniel and Wright Cheryl
Home Financials for this Owner
Home Financials are based on the most recent Mortgage that was taken out on this home.
Original Mortgage
$112,238
Interest Rate
6.32%
Mortgage Type
FHA
Purchase Details
Closed on
Nov 26, 2002
Sold by
Pollock Donald L
Bought by
Njhr 2 Llc
Purchase Details
Closed on
Jul 17, 2001
Sold by
First Union National Bank
Bought by
Pollock Donald L
Create a Home Valuation Report for This Property
The Home Valuation Report is an in-depth analysis detailing your home's value as well as a comparison with similar homes in the area
Home Values in the Area
Average Home Value in this Area
Purchase History
| Date | Buyer | Sale Price | Title Company |
|---|---|---|---|
| Campbell George | -- | None Listed On Document | |
| Campbell George | -- | None Listed On Document | |
| Campbell George | $70,101 | -- | |
| Hud | $122,611 | -- | |
| Wright Daniel | $119,900 | -- | |
| Njhr 2 Llc | -- | -- | |
| Pollock Donald L | $35,000 | -- | |
| Pollock Donald L | $35,000 | -- |
Source: Public Records
Mortgage History
| Date | Status | Borrower | Loan Amount |
|---|---|---|---|
| Previous Owner | Wright Daniel | $112,238 |
Source: Public Records
Tax History Compared to Growth
Tax History
| Year | Tax Paid | Tax Assessment Tax Assessment Total Assessment is a certain percentage of the fair market value that is determined by local assessors to be the total taxable value of land and additions on the property. | Land | Improvement |
|---|---|---|---|---|
| 2025 | $6,150 | $109,100 | $19,000 | $90,100 |
| 2024 | $5,937 | $109,100 | $19,000 | $90,100 |
| 2023 | $5,937 | $109,100 | $19,000 | $90,100 |
| 2022 | $5,767 | $109,100 | $19,000 | $90,100 |
| 2021 | $1,859 | $109,100 | $19,000 | $90,100 |
| 2020 | $5,766 | $109,100 | $19,000 | $90,100 |
| 2019 | $849 | $109,100 | $19,000 | $90,100 |
| 2018 | $5,930 | $109,100 | $19,000 | $90,100 |
| 2017 | $5,803 | $109,100 | $19,000 | $90,100 |
| 2016 | $5,957 | $141,300 | $42,800 | $98,500 |
| 2015 | $5,728 | $139,700 | $42,800 | $96,900 |
| 2014 | $5,563 | $139,700 | $42,800 | $96,900 |
Source: Public Records
Map
Nearby Homes
- 166 W Clearview Ave
- 0 W Woodburn Ave
- 16 E 7th Ave
- 4 East E 9th St
- 1110 Erial Rd
- 22 Millstream Rd
- 24 Gristmill Ln
- 44 E 4th Ave
- 26 W 1st Ave
- 148 Diamond Ave
- 14 Players Ln
- 19 E 2nd Ave
- 503 Bromley Estate
- 502 Bromley Estate
- 85 E 9th Ave
- 1502 Bromley Estate
- 113 Lakeview Ave
- 215 Erial Rd
- 91 Mount Clement Ave
- 300 Turnerville Rd
- 160 W Branch Ave
- 172 W Branch Ave
- 154 W Branch Ave
- 149 W Clearview Ave
- 145 W Clearview Ave
- 175 W Branch Ave
- 146 W Branch Ave
- 174 W Branch Ave
- 143 W Clearview Ave
- 65 W 7th Ave
- W Branch Ave
- 140 W Branch Ave
- 174 W Clearview Ave
- 61 W 7th Ave
- 136 W Branch Ave
- 132 W Clearview Ave
- 178 W Clearview Ave
- 57 W 7th Ave
- 135 W Clearview Ave
- 128 W Clearview Ave