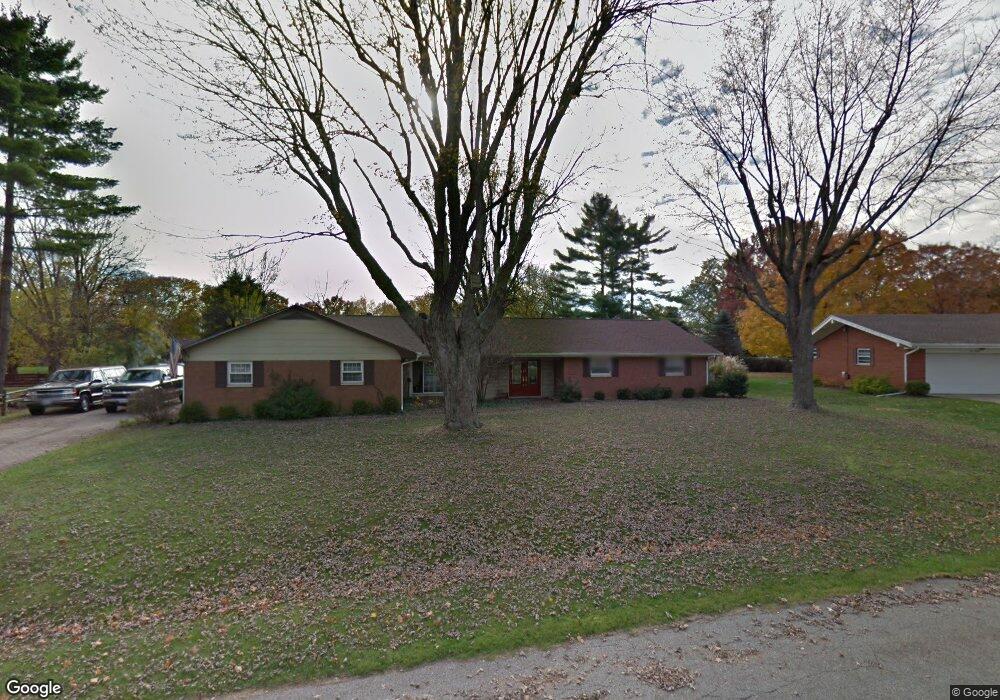
170 Winchcombe Dr Dayton, OH 45459
Woodbourne-Hyde Park NeighborhoodEstimated Value: $351,000 - $393,589
4
Beds
3
Baths
2,540
Sq Ft
$149/Sq Ft
Est. Value
About This Home
This home is located at 170 Winchcombe Dr, Dayton, OH 45459 and is currently estimated at $378,147, approximately $148 per square foot. 170 Winchcombe Dr is a home located in Montgomery County with nearby schools including Primary Village North, John Hole Elementary, and Hadley E Watts Middle School.
Ownership History
Date
Name
Owned For
Owner Type
Purchase Details
Closed on
Mar 8, 2022
Sold by
Sks Real Estate Llc
Bought by
Pty Sec
Current Estimated Value
Purchase Details
Closed on
Oct 19, 2021
Sold by
Gourley Donalda K
Bought by
Donni Llc
Purchase Details
Closed on
Oct 16, 2021
Sold by
Skinner Brady
Bought by
Sks Real Estate Llc
Purchase Details
Closed on
Sep 17, 2021
Sold by
Estate Of Stuart Skinner
Bought by
Skinner Brady and Gourley Donalda K
Purchase Details
Closed on
Aug 21, 2013
Sold by
Skinner Kathryn A
Bought by
Skinner Stuart
Home Financials for this Owner
Home Financials are based on the most recent Mortgage that was taken out on this home.
Original Mortgage
$77,300
Interest Rate
4.29%
Mortgage Type
Purchase Money Mortgage
Purchase Details
Closed on
Jan 30, 1998
Sold by
Schmidt Guy A and Schmidt Kimberly
Bought by
Skinner Kathryn A
Home Financials for this Owner
Home Financials are based on the most recent Mortgage that was taken out on this home.
Original Mortgage
$124,800
Interest Rate
7.16%
Create a Home Valuation Report for This Property
The Home Valuation Report is an in-depth analysis detailing your home's value as well as a comparison with similar homes in the area
Home Values in the Area
Average Home Value in this Area
Purchase History
| Date | Buyer | Sale Price | Title Company |
|---|---|---|---|
| Pty Sec | $7,179 | None Listed On Document | |
| Donni Llc | -- | None Available | |
| Sks Real Estate Llc | -- | None Available | |
| Skinner Brady | -- | None Available | |
| Skinner Stuart | $96,700 | None Available | |
| Skinner Kathryn A | $156,200 | Midwest Abstract Company | |
| Skinner Kathryn A | $156,200 | Midwest Abstract Company |
Source: Public Records
Mortgage History
| Date | Status | Borrower | Loan Amount |
|---|---|---|---|
| Previous Owner | Skinner Stuart | $77,300 | |
| Previous Owner | Skinner Kathryn A | $124,800 |
Source: Public Records
Tax History Compared to Growth
Tax History
| Year | Tax Paid | Tax Assessment Tax Assessment Total Assessment is a certain percentage of the fair market value that is determined by local assessors to be the total taxable value of land and additions on the property. | Land | Improvement |
|---|---|---|---|---|
| 2024 | $6,379 | $103,490 | $17,510 | $85,980 |
| 2023 | $6,379 | $103,490 | $17,510 | $85,980 |
| 2022 | $5,927 | $74,480 | $12,600 | $61,880 |
| 2021 | $5,943 | $74,480 | $12,600 | $61,880 |
| 2020 | $5,811 | $74,480 | $12,600 | $61,880 |
| 2019 | $4,267 | $48,800 | $12,600 | $36,200 |
| 2018 | $3,812 | $48,800 | $12,600 | $36,200 |
| 2017 | $3,771 | $48,800 | $12,600 | $36,200 |
| 2016 | $4,154 | $50,690 | $12,600 | $38,090 |
| 2015 | $4,067 | $50,690 | $12,600 | $38,090 |
| 2014 | $4,067 | $60,040 | $12,600 | $47,440 |
| 2012 | -- | $48,320 | $12,600 | $35,720 |
Source: Public Records
Map
Nearby Homes
- 190 Winchcombe Dr
- 160 Ashford Dr
- 187 Cheltenham Dr
- 152 Cheltenham Dr
- 341 Cardigan Rd
- 129 Lamp Lighter Trail
- 40 Nicholson Ct Unit 4
- 24 Nicholson Ct Unit 10
- 447 Greensboro Dr
- 5290 Wheaton St
- 5416 Landau Dr Unit 7
- 5416 Landau Dr Unit 5
- 5380 Landau Dr Unit 40
- 215 Colonial Ln
- 5328 Landau Dr Unit 49
- 5328 Landau Dr
- 427 Meadowview Dr
- 5920 Mad River Rd
- 6013 Gothic Place
- 194 Brookmount Rd
- 180 Winchcombe Dr
- 247 Cheltenham Dr
- 160 Winchcombe Dr
- 269 Cheltenham Dr
- 170 Ashford Dr
- 227 Cheltenham Dr
- 5702 Kirkstone Dr
- 5666 Kirkstone Dr
- 159 Winchcombe Dr
- 150 Winchcombe Dr
- 207 Cheltenham Dr
- 203 Winchcombe Dr
- 5652 Kirkstone Dr
- 246 Cheltenham Dr
- 200 Winchcombe Dr
- 264 Cheltenham Dr
- 228 Cheltenham Dr
- 149 Winchcombe Dr
- 303 Cheltenham Dr
- 286 Cheltenham Dr