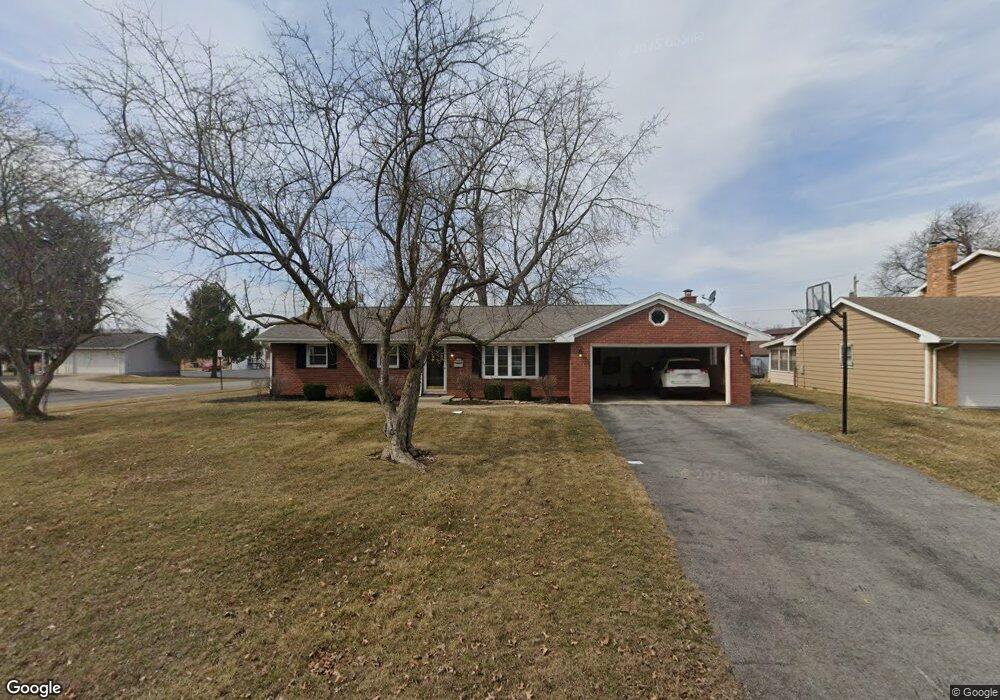
1700 Cherry Ln Findlay, OH 45840
Estimated Value: $224,608 - $247,000
3
Beds
2
Baths
1,504
Sq Ft
$155/Sq Ft
Est. Value
About This Home
This home is located at 1700 Cherry Ln, Findlay, OH 45840 and is currently estimated at $232,902, approximately $154 per square foot. 1700 Cherry Ln is a home located in Hancock County with nearby schools including Wilson Vance Elementary School, Whittier Elementary School, and Glenwood Middle School.
Ownership History
Date
Name
Owned For
Owner Type
Purchase Details
Closed on
Jul 26, 2017
Sold by
Skulina Fred W and Skulina Susan E
Bought by
Oman Sean C and Morehead Katelyn K
Current Estimated Value
Home Financials for this Owner
Home Financials are based on the most recent Mortgage that was taken out on this home.
Original Mortgage
$161,499
Outstanding Balance
$134,540
Interest Rate
3.9%
Mortgage Type
VA
Estimated Equity
$98,362
Purchase Details
Closed on
Jul 20, 2005
Sold by
Kissick Nancy
Bought by
Skulina Susan E and Estate Of Patsy P Kissick
Purchase Details
Closed on
Oct 1, 1993
Bought by
Skulina Fred W and Skulina Susan
Purchase Details
Closed on
Aug 15, 1990
Bought by
Claes Timothy S and Mary Lou
Purchase Details
Closed on
Nov 15, 1988
Bought by
Holman Ronald P and Holman Jane L
Create a Home Valuation Report for This Property
The Home Valuation Report is an in-depth analysis detailing your home's value as well as a comparison with similar homes in the area
Home Values in the Area
Average Home Value in this Area
Purchase History
| Date | Buyer | Sale Price | Title Company |
|---|---|---|---|
| Oman Sean C | $158,100 | Mid Am Title Agency | |
| Skulina Susan E | -- | Golden Key Title | |
| Skulina Fred W | $94,000 | -- | |
| Claes Timothy S | $85,000 | -- | |
| Holman Ronald P | $77,900 | -- |
Source: Public Records
Mortgage History
| Date | Status | Borrower | Loan Amount |
|---|---|---|---|
| Open | Oman Sean C | $161,499 |
Source: Public Records
Tax History
| Year | Tax Paid | Tax Assessment Tax Assessment Total Assessment is a certain percentage of the fair market value that is determined by local assessors to be the total taxable value of land and additions on the property. | Land | Improvement |
|---|---|---|---|---|
| 2024 | $1,968 | $55,400 | $9,640 | $45,760 |
| 2023 | $1,971 | $55,400 | $9,640 | $45,760 |
| 2022 | $1,964 | $55,400 | $9,640 | $45,760 |
| 2021 | $1,774 | $43,590 | $10,140 | $33,450 |
| 2020 | $1,774 | $43,590 | $10,140 | $33,450 |
| 2019 | $1,738 | $43,590 | $10,140 | $33,450 |
| 2018 | $1,648 | $37,910 | $8,820 | $29,090 |
| 2017 | $824 | $37,910 | $8,820 | $29,090 |
| 2016 | $1,629 | $37,910 | $8,820 | $29,090 |
| 2015 | $1,774 | $40,560 | $8,820 | $31,740 |
| 2014 | $1,774 | $40,560 | $8,820 | $31,740 |
| 2012 | $1,860 | $42,230 | $8,820 | $33,410 |
Source: Public Records
Map
Nearby Homes
- 1642 Cherry Ln
- 0 Bright Rd Unit 6117142
- 0 Bright Rd Unit 6117138
- 0 Bright Rd Unit 6117143
- 0 Bright Rd Unit 6117148
- 1450 Fostoria Ave
- 0 Romick Pkwy Unit 6131435
- 0 Romick Pkwy Unit 6123797
- 1331 Countryside Dr
- 1724 Queenswood Dr Unit 10 (2-C)
- 1203 Chateau Ct
- 1828 Queenswood Dr
- 1521 Middle Ct
- 1474 Southwood Ave
- 631 Winterhaven Dr
- 1216 Concord Ct
- 1448 Eastshore Dr
- 1926 Queenswood Dr Unit 4
- 1825 Greendale Ave
- 0 Keith Pkwy Unit 6123798
- 1704 Cherry Ln
- 1648 Cherry Ln
- 1708 Cherry Ln
- 1701 Cherry Ln
- 1707 Cherry Ln
- 1712 Cherry Ln
- 1649 Cherry Ln
- 1715 Cherry Ln
- 1718 Cherry Ln
- 1636 Cherry Ln
- 1700 Hilton Ave
- 1719 Cherry Ln
- 1706 Hilton Ave
- 1648 Hilton Ave
- 1722 Cherry Ln
- 1635 Cherry Ln
- 1712 Hilton Ave
- 1723 Cherry Ln
- 1640 Hilton Ave
- 1630 Cherry Ln
Your Personal Tour Guide
Ask me questions while you tour the home.