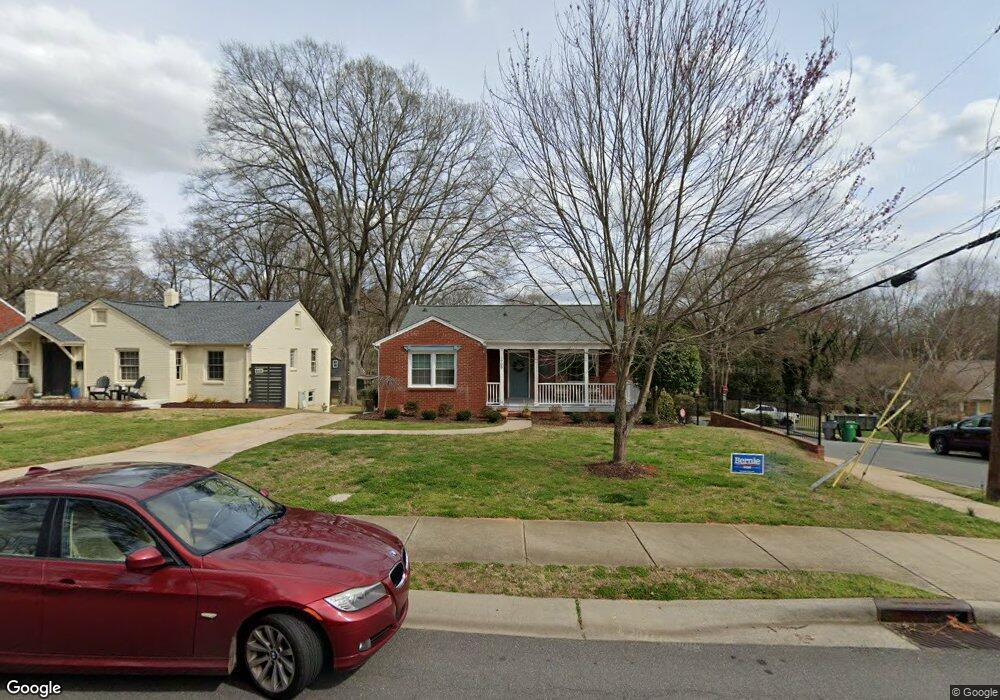
1700 Dearmon Dr Charlotte, NC 28205
Plaza Midwood NeighborhoodEstimated Value: $713,794 - $805,000
3
Beds
1
Bath
1,181
Sq Ft
$645/Sq Ft
Est. Value
About This Home
This home is located at 1700 Dearmon Dr, Charlotte, NC 28205 and is currently estimated at $761,199, approximately $644 per square foot. 1700 Dearmon Dr is a home located in Mecklenburg County with nearby schools including Shamrock Gardens Elementary School, Eastway Middle School, and Garinger High School.
Ownership History
Date
Name
Owned For
Owner Type
Purchase Details
Closed on
Sep 25, 2019
Sold by
Whitehead Michael T and Whitehead Elizabeth M
Bought by
Hare Brenda
Current Estimated Value
Home Financials for this Owner
Home Financials are based on the most recent Mortgage that was taken out on this home.
Original Mortgage
$433,200
Outstanding Balance
$380,278
Interest Rate
3.6%
Mortgage Type
New Conventional
Estimated Equity
$380,921
Purchase Details
Closed on
Apr 11, 2016
Sold by
Podosek Randolph and Podosek Helen S
Bought by
Whitehead Michael T and Whitehead Elizabeth M
Purchase Details
Closed on
Mar 11, 2015
Sold by
Podosek Randolph and Podosek Helen S
Bought by
Podosek Randolph and Podosek Helen S
Purchase Details
Closed on
Aug 18, 2011
Sold by
Brafford Patsy S
Bought by
Podosek Randolph
Home Financials for this Owner
Home Financials are based on the most recent Mortgage that was taken out on this home.
Original Mortgage
$166,250
Interest Rate
4.54%
Mortgage Type
New Conventional
Create a Home Valuation Report for This Property
The Home Valuation Report is an in-depth analysis detailing your home's value as well as a comparison with similar homes in the area
Home Values in the Area
Average Home Value in this Area
Purchase History
| Date | Buyer | Sale Price | Title Company |
|---|---|---|---|
| Hare Brenda | $470,000 | Coastello Title | |
| Whitehead Michael T | $325,000 | None Available | |
| Podosek Randolph | -- | None Available | |
| Podosek Randolph | $175,000 | None Available |
Source: Public Records
Mortgage History
| Date | Status | Borrower | Loan Amount |
|---|---|---|---|
| Open | Hare Brenda | $433,200 | |
| Previous Owner | Podosek Randolph | $166,250 |
Source: Public Records
Tax History
| Year | Tax Paid | Tax Assessment Tax Assessment Total Assessment is a certain percentage of the fair market value that is determined by local assessors to be the total taxable value of land and additions on the property. | Land | Improvement |
|---|---|---|---|---|
| 2025 | $4,973 | $636,500 | $350,000 | $286,500 |
| 2024 | $4,973 | $636,500 | $350,000 | $286,500 |
| 2023 | $4,808 | $636,500 | $350,000 | $286,500 |
| 2022 | $3,505 | $350,200 | $210,000 | $140,200 |
| 2021 | $3,494 | $350,200 | $210,000 | $140,200 |
| 2020 | $3,487 | $350,200 | $210,000 | $140,200 |
| 2019 | $3,471 | $350,200 | $210,000 | $140,200 |
| 2018 | $3,240 | $241,400 | $152,000 | $89,400 |
| 2017 | $3,188 | $241,400 | $152,000 | $89,400 |
| 2016 | $3,178 | $241,400 | $152,000 | $89,400 |
| 2015 | $3,167 | $241,400 | $152,000 | $89,400 |
| 2014 | $3,163 | $246,100 | $152,000 | $94,100 |
Source: Public Records
Map
Nearby Homes
- 1804 Dearmon Dr
- 1919 Club Rd
- 1527 Saint George St
- 2314 Wolfe St
- 1421 Lyon Ct
- 1905 Chatham Ave
- 1600 Fulton Ave Unit 204
- 1701 Fulton Ave
- 1317 Morningside Dr
- 1901 Graybark Ave
- 1824 Kenwood Ave
- 1603 Tippah Park Ct
- 1607 Tippah Park Ct
- 2214 Chatham Ave
- 1810 Ferguson Ct
- 3301 Draper Ave
- 1822 Hall Ave
- 1519 Briar Creek Rd Unit B
- 1424 Nandina St
- 3444 Cosby Place
- 1704 Dearmon Dr
- 1708 Dearmon Dr
- 1712 Dearmon Dr
- 2616 Roland St
- 2610 Roland St
- 1716 Dearmon Dr
- 2606 Roland St
- 1642 Morningside Dr
- 1709 Dearmon Dr
- 2620 Roland St
- 1715 Dearmon Dr
- 1636 Morningside Dr
- 1720 Dearmon Dr
- 1725 Logie Ave
- 1721 Logie Ave
- 1721 Dearmon Dr
- 1713 Logie Ave
- 1632 Morningside Dr
- 1729 Logie Ave
- 1717 Logie Ave
Your Personal Tour Guide
Ask me questions while you tour the home.