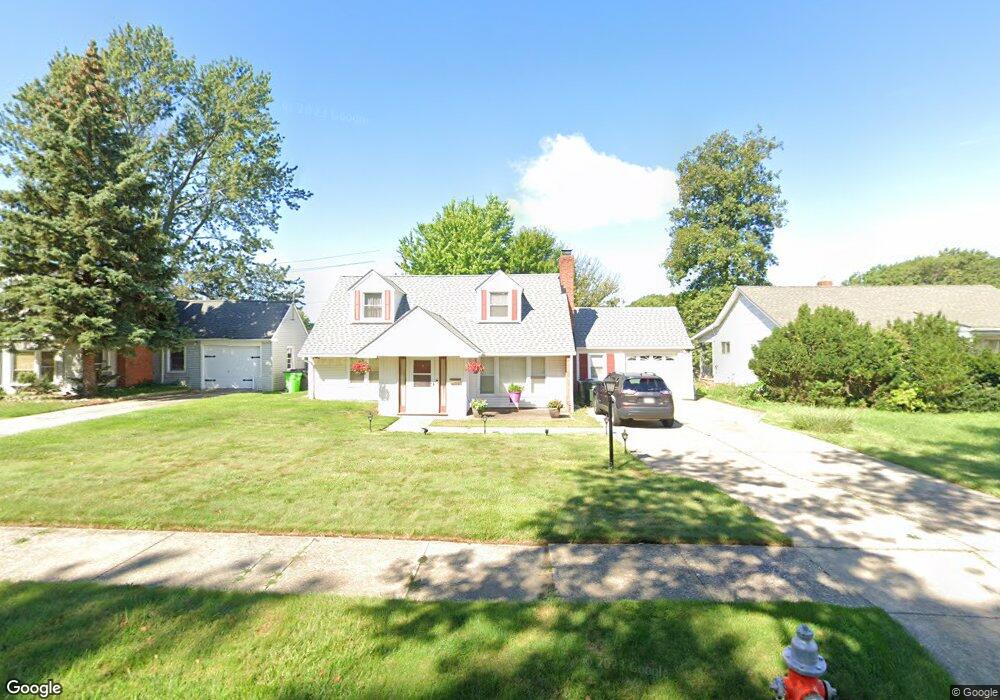
1700 E 236th St Euclid, OH 44117
Estimated Value: $165,000 - $175,000
4
Beds
2
Baths
1,485
Sq Ft
$114/Sq Ft
Est. Value
About This Home
This home is located at 1700 E 236th St, Euclid, OH 44117 and is currently estimated at $169,956, approximately $114 per square foot. 1700 E 236th St is a home located in Cuyahoga County with nearby schools including Thomas Jefferson Elementary School, Euclid Middle School, and Euclid High School.
Ownership History
Date
Name
Owned For
Owner Type
Purchase Details
Closed on
Jun 1, 2005
Sold by
Vetturini Carol and Vetturini Domenic
Bought by
Pittman Roosevelt
Current Estimated Value
Home Financials for this Owner
Home Financials are based on the most recent Mortgage that was taken out on this home.
Original Mortgage
$127,900
Outstanding Balance
$67,415
Interest Rate
5.91%
Mortgage Type
Fannie Mae Freddie Mac
Estimated Equity
$102,541
Purchase Details
Closed on
Jul 21, 1992
Sold by
Lavigna Carol R
Bought by
Lavigna Carol P
Purchase Details
Closed on
Aug 9, 1990
Sold by
Fitzpatrick Timothy
Bought by
Lavigna Carol R
Purchase Details
Closed on
Dec 6, 1988
Sold by
Cuonzo Michelle A
Bought by
Fitzpatrick Timothy
Purchase Details
Closed on
Jan 13, 1982
Sold by
Sivik Jack R and Sivik Marilyn L
Bought by
Cuonzo Michelle A
Purchase Details
Closed on
Jan 1, 1975
Bought by
Sivik Jack R and Sivik Marilyn L
Create a Home Valuation Report for This Property
The Home Valuation Report is an in-depth analysis detailing your home's value as well as a comparison with similar homes in the area
Home Values in the Area
Average Home Value in this Area
Purchase History
| Date | Buyer | Sale Price | Title Company |
|---|---|---|---|
| Pittman Roosevelt | $127,900 | Enterprise Title Agency | |
| Lavigna Carol P | -- | -- | |
| Lavigna Carol R | $79,000 | -- | |
| Fitzpatrick Timothy | $76,000 | -- | |
| Cuonzo Michelle A | $53,000 | -- | |
| Sivik Jack R | -- | -- |
Source: Public Records
Mortgage History
| Date | Status | Borrower | Loan Amount |
|---|---|---|---|
| Open | Pittman Roosevelt | $127,900 |
Source: Public Records
Tax History
| Year | Tax Paid | Tax Assessment Tax Assessment Total Assessment is a certain percentage of the fair market value that is determined by local assessors to be the total taxable value of land and additions on the property. | Land | Improvement |
|---|---|---|---|---|
| 2024 | $3,561 | $52,010 | $10,500 | $41,510 |
| 2023 | $2,984 | $34,550 | $8,190 | $26,360 |
| 2022 | $2,916 | $34,545 | $8,190 | $26,355 |
| 2021 | $3,249 | $34,550 | $8,190 | $26,360 |
| 2020 | $3,081 | $29,790 | $7,070 | $22,720 |
| 2019 | $2,771 | $85,100 | $20,200 | $64,900 |
| 2018 | $2,750 | $29,790 | $7,070 | $22,720 |
| 2017 | $2,932 | $26,080 | $5,670 | $20,410 |
| 2016 | $2,939 | $26,080 | $5,670 | $20,410 |
| 2015 | $2,703 | $26,080 | $5,670 | $20,410 |
| 2014 | $2,674 | $26,080 | $5,670 | $20,410 |
Source: Public Records
Map
Nearby Homes
- 1754 E 236th St
- 23501 Effingham Blvd
- 1765 E 238th St
- 1775 Sherwood Blvd
- 24105 Chardon Rd
- 21950 Euclid Ave
- 1554 E 221st St
- 363 Balmoral Dr
- 1934 Beverly Hills Dr
- 25031 Glenbrook Blvd
- 1545 E 214th St
- 22791 Harms Rd
- 22601 Harms Rd
- 24691 Hawthorne Dr
- 25550 Glenbrook Blvd
- 25641 Glenbrook Blvd
- 24991 Euclid Ave
- 1734 Glenridge Rd
- 1732 Glenridge Rd
- 1790 Skyline Dr
- 1710 E 236th St
- 1720 E 236th St
- 1692 E 236th St
- 1703 E 236th St
- 1711 E 236th St
- 1701 E 236th St
- 1730 E 236th St
- 1721 E 236th St
- 23600 Glenbrook Blvd
- 1740 E 236th St
- 1731 E 236th St
- 23650 Glenbrook Blvd
- 1712 E 238th St
- 1708 E 238th St
- 1716 E 238th St
- 1746 E 236th St
- 1704 E 238th St
- 1720 E 238th St
- 1741 E 236th St
- 1700 E 238th St
Your Personal Tour Guide
Ask me questions while you tour the home.