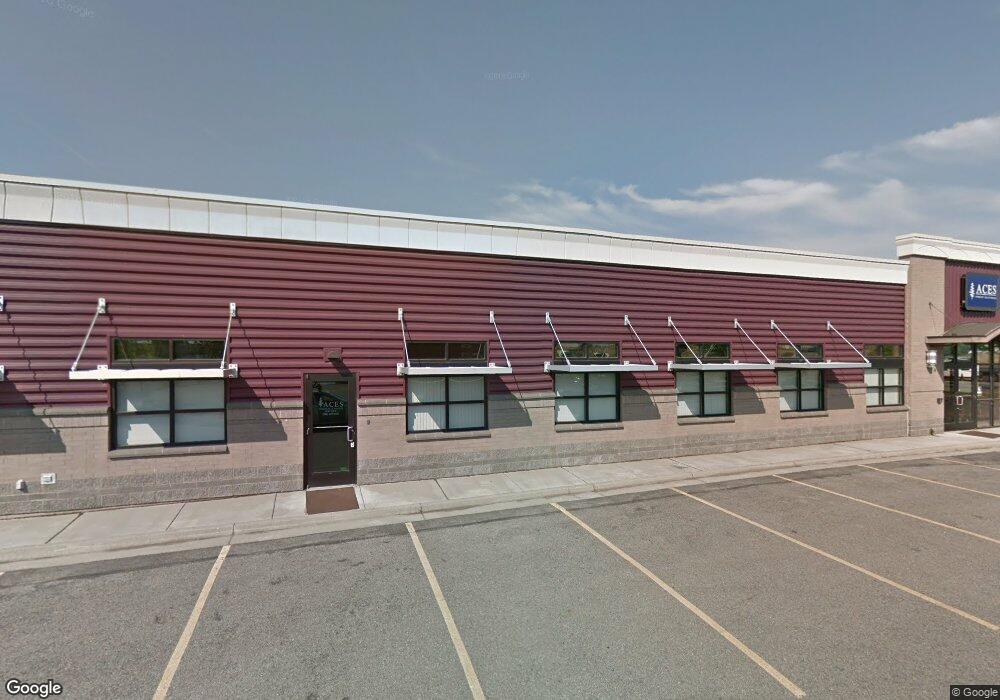
1700 E Schneidmiller Ave Post Falls, ID 83854
Estimated Value: $1,403,605
--
Bed
--
Bath
5,800
Sq Ft
$242/Sq Ft
Est. Value
About This Home
This home is located at 1700 E Schneidmiller Ave, Post Falls, ID 83854 and is currently estimated at $1,403,605, approximately $242 per square foot. 1700 E Schneidmiller Ave is a home located in Kootenai County with nearby schools including Ponderosa Elementary School, Post Falls Middle School, and Post Falls High School.
Ownership History
Date
Name
Owned For
Owner Type
Purchase Details
Closed on
Aug 14, 2018
Sold by
1700 Schneidmiller Llc
Bought by
St Patrick Properties Llc
Current Estimated Value
Purchase Details
Closed on
Mar 3, 2014
Sold by
Unio Development Llc
Bought by
1700 Schneidmiller Llc
Purchase Details
Closed on
Feb 22, 2013
Sold by
Mountain West Bank
Bought by
Unio Development Llc
Home Financials for this Owner
Home Financials are based on the most recent Mortgage that was taken out on this home.
Original Mortgage
$478,500
Interest Rate
3.36%
Mortgage Type
Future Advance Clause Open End Mortgage
Purchase Details
Closed on
Dec 1, 2012
Sold by
Pf C21 Llc
Bought by
Mountain West Bank
Purchase Details
Closed on
Jun 6, 2005
Sold by
Beutler John A and Beutler Ann J
Bought by
Beutler John A and Beutler Ann J
Create a Home Valuation Report for This Property
The Home Valuation Report is an in-depth analysis detailing your home's value as well as a comparison with similar homes in the area
Home Values in the Area
Average Home Value in this Area
Purchase History
| Date | Buyer | Sale Price | Title Company |
|---|---|---|---|
| St Patrick Properties Llc | -- | North Idaho Title Company | |
| 1700 Schneidmiller Llc | -- | Accommodation | |
| Unio Development Llc | -- | North Idaho Title Company | |
| Mountain West Bank | -- | North Idaho Title Company | |
| Beutler John A | -- | -- |
Source: Public Records
Mortgage History
| Date | Status | Borrower | Loan Amount |
|---|---|---|---|
| Previous Owner | Unio Development Llc | $478,500 |
Source: Public Records
Tax History Compared to Growth
Tax History
| Year | Tax Paid | Tax Assessment Tax Assessment Total Assessment is a certain percentage of the fair market value that is determined by local assessors to be the total taxable value of land and additions on the property. | Land | Improvement |
|---|---|---|---|---|
| 2024 | $7,098 | $1,171,377 | $661,675 | $509,702 |
| 2023 | $7,098 | $1,171,377 | $661,675 | $509,702 |
| 2022 | $5,538 | $930,106 | $514,972 | $415,134 |
| 2021 | $8,443 | $864,415 | $468,088 | $396,327 |
| 2020 | $9,476 | $859,551 | $468,088 | $391,463 |
| 2019 | $10,286 | $842,366 | $445,780 | $396,586 |
| 2018 | $10,129 | $754,739 | $387,553 | $367,186 |
| 2017 | $10,548 | $720,911 | $389,065 | $331,846 |
| 2016 | $11,129 | $720,911 | $353,523 | $367,388 |
| 2015 | $5,651 | $720,911 | $321,385 | $399,526 |
| 2013 | $12,205 | $720,911 | $321,385 | $399,526 |
Source: Public Records
Map
Nearby Homes
- 1704 E Coeur d Alene Ave
- 1613 E Coeur d Alene Ave
- 1809 E 3rd Ave
- 1807 E 3rd Ave
- 311 N Handy St
- 304 N Greensferry Rd Unit 108
- L1B1 N Post Falls Dr
- 1163 E Polston Ave
- 1048 E 4th Ave Unit 104
- 1048 E 4th Ave
- 1504 E 3rd Ave
- 813 N Doryport Ct
- 634 N Calgary Ct
- 1613 E Park Ln
- 1505 E 1st Ave
- 1414 E Mordyl Loop
- 1952 E 12th Ave Unit 15
- 1952 E 12th Ave Unit 2
- 1157 N Day Ln
- 1903 E Strand Ave
- 1670 E Schneidmiller Ave
- 1711 E Schneidmiller Ave
- 1645 E Seltice Way
- 1645 E Seltice Way
- 1640 E Schneidmiller Ave
- 1780 E Schneidmiller Ave
- 525 N Graffiti St
- 1610 E Schneidmiller Ave
- 1815 E Seltice Way
- 1800 Seltice Way
- 1704 E Seltice Way
- 1710 E Seltice Way
- 1790 E Seltice Way
- 1616 E Seltice Way
- 1605 E Seltice Way
- 1605 Seltice Way
- 1850 E Seltice Way
- 1603 E Seltice Way
- 1905 E Seltice Way
- 1881 W Seltice Way Lt 2