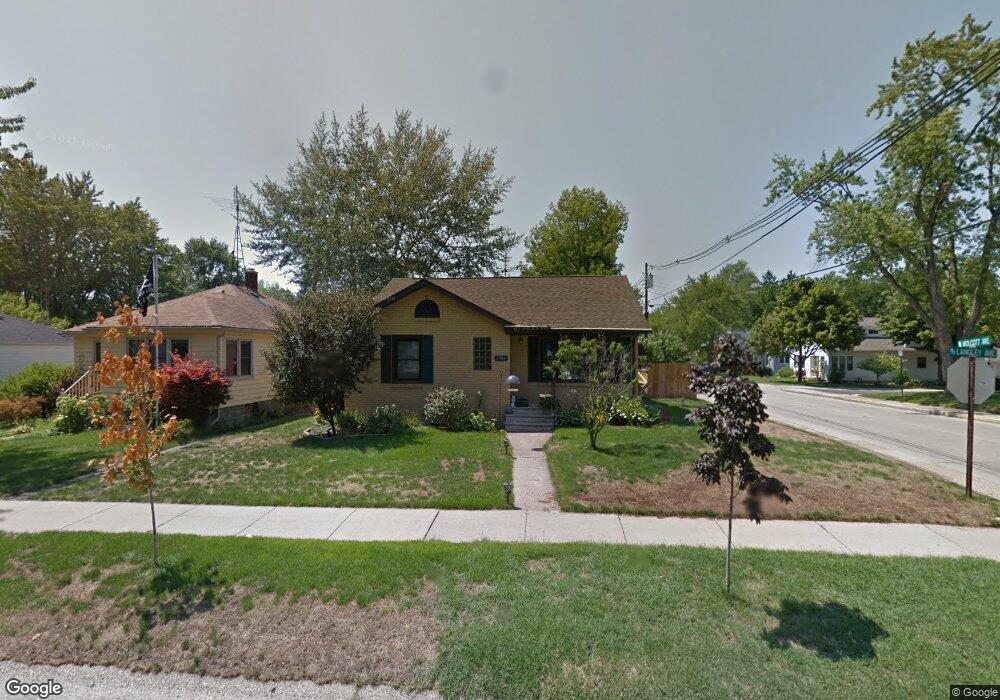
1700 Langley Ave Saint Joseph, MI 49085
Estimated Value: $243,299 - $269,000
3
Beds
1
Bath
1,800
Sq Ft
$142/Sq Ft
Est. Value
About This Home
This home is located at 1700 Langley Ave, Saint Joseph, MI 49085 and is currently estimated at $256,325, approximately $142 per square foot. 1700 Langley Ave is a home located in Berrien County with nearby schools including Upton Middle School, St. Joseph High School, and Benton Harbor Charter School Academy.
Ownership History
Date
Name
Owned For
Owner Type
Purchase Details
Closed on
Jun 27, 2008
Sold by
Siewert Dana L and Worrell Timothy C
Bought by
Harte Johnathan S
Current Estimated Value
Home Financials for this Owner
Home Financials are based on the most recent Mortgage that was taken out on this home.
Original Mortgage
$110,432
Interest Rate
6.05%
Mortgage Type
FHA
Purchase Details
Closed on
Aug 3, 2006
Sold by
Ashbrook Carl E and Ashbrook Karla R
Bought by
Citifinancial Mortgage Co Inc
Purchase Details
Closed on
Aug 13, 2003
Sold by
Ashbrook Karla R
Bought by
Ashbrook Karla R and Ashbrook Carl E
Home Financials for this Owner
Home Financials are based on the most recent Mortgage that was taken out on this home.
Original Mortgage
$88,400
Interest Rate
8.77%
Mortgage Type
Purchase Money Mortgage
Purchase Details
Closed on
Jul 31, 1995
Purchase Details
Closed on
Apr 29, 1992
Purchase Details
Closed on
Dec 11, 1990
Purchase Details
Closed on
Nov 3, 1990
Create a Home Valuation Report for This Property
The Home Valuation Report is an in-depth analysis detailing your home's value as well as a comparison with similar homes in the area
Home Values in the Area
Average Home Value in this Area
Purchase History
| Date | Buyer | Sale Price | Title Company |
|---|---|---|---|
| Harte Johnathan S | $146,730 | Met | |
| Citifinancial Mortgage Co Inc | $87,567 | None Available | |
| Ashbrook Karla R | -- | -- | |
| -- | $87,500 | -- | |
| -- | $77,000 | -- | |
| -- | $69,900 | -- | |
| -- | $69,900 | -- |
Source: Public Records
Mortgage History
| Date | Status | Borrower | Loan Amount |
|---|---|---|---|
| Closed | Harte Johnathan S | $110,432 | |
| Previous Owner | Ashbrook Karla R | $88,400 |
Source: Public Records
Tax History Compared to Growth
Tax History
| Year | Tax Paid | Tax Assessment Tax Assessment Total Assessment is a certain percentage of the fair market value that is determined by local assessors to be the total taxable value of land and additions on the property. | Land | Improvement |
|---|---|---|---|---|
| 2025 | $2,897 | $102,700 | $0 | $0 |
| 2024 | $2,810 | $98,300 | $0 | $0 |
| 2023 | $2,695 | $78,800 | $0 | $0 |
| 2022 | $2,573 | $77,700 | $0 | $0 |
| 2021 | $2,556 | $75,100 | $22,900 | $52,200 |
| 2020 | $2,522 | $72,800 | $0 | $0 |
| 2019 | $2,502 | $63,200 | $21,600 | $41,600 |
| 2018 | $2,460 | $63,200 | $0 | $0 |
| 2017 | $2,207 | $62,400 | $0 | $0 |
| 2016 | $2,207 | $59,900 | $0 | $0 |
| 2015 | $2,180 | $57,600 | $0 | $0 |
| 2014 | $2,228 | $60,800 | $0 | $0 |
Source: Public Records
Map
Nearby Homes
- 1311 Wolcott Ave
- 1325 Michigan Ave
- 1328 Harrison Ave
- 2108 Langley Ave
- 2019 Sunset Dr
- 1004 Harrison Ave
- 1008 Wayne St
- 828 Wolcott Ave
- 1019 Pearl St
- 200 Lake St Unit 3C
- 200 Lake St Unit 4C
- 200 Lake St Unit 7A/8A
- 200 Lake St Unit 3B
- 398 Anchors Way Unit 82s
- 398 Anchors Way Unit 87s
- 2206 Morton Ave
- 808 Wisconsin Ave
- 1221 Broad St Unit 3
- 1000 Riverview Dr Unit 11
- 39884 Anchors Way
- 1702 Langley Ave
- 1704 Langley Ave
- 1701 Langley Ave
- 1336 Wolcott Ave
- 1401 Wolcott Ave
- 1710 Langley Ave
- 1624 Langley Ave
- 1332 Wolcott Ave
- 1337 Wolcott Ave
- 1709 Langley Ave
- 1625 Langley Ave
- 1339 Lewis Ave
- 1327 Wolcott Ave
- 1328 Wolcott Ave
- 1303 Wolcott Ave
- 1404 Wolcott Ave
- 1621 Langley Ave
- 1403 Lewis Ave
- 1325 Wolcott Ave
- 1607 Langley Ave