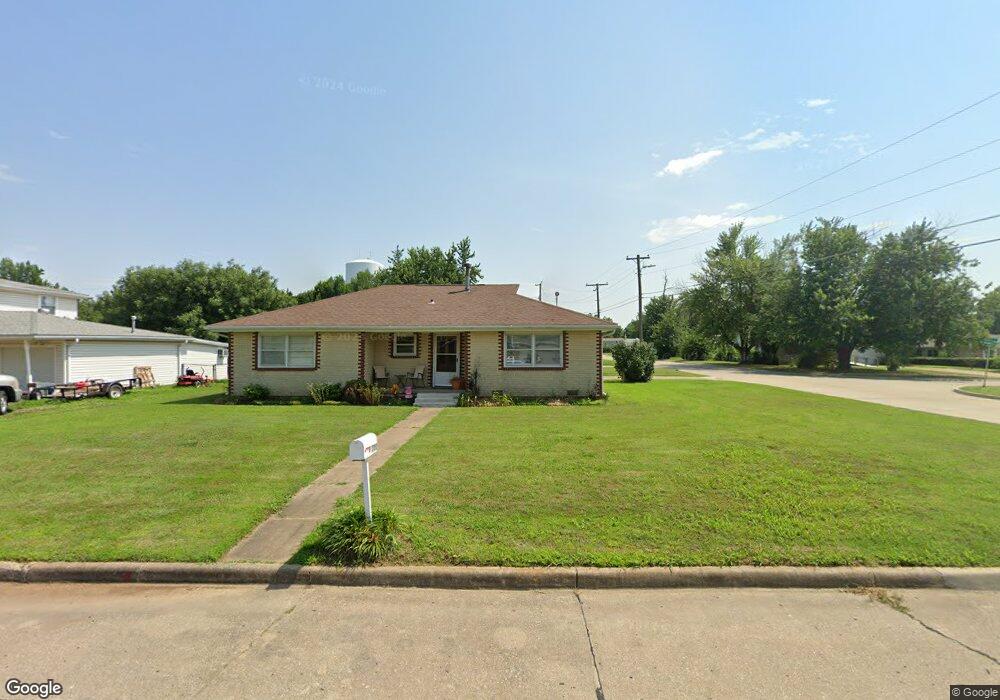
1700 Leslie Ln Ponca City, OK 74604
Estimated Value: $130,000 - $167,000
3
Beds
2
Baths
1,419
Sq Ft
$109/Sq Ft
Est. Value
About This Home
This home is located at 1700 Leslie Ln, Ponca City, OK 74604 and is currently estimated at $155,078, approximately $109 per square foot. 1700 Leslie Ln is a home located in Kay County with nearby schools including E.M. Trout Elementary School, Ponca City East Middle School, and Ponca City West Middle School.
Ownership History
Date
Name
Owned For
Owner Type
Purchase Details
Closed on
Aug 28, 2017
Sold by
Nail Michael T and Nail Danieil
Bought by
Dingus Alaina
Current Estimated Value
Home Financials for this Owner
Home Financials are based on the most recent Mortgage that was taken out on this home.
Original Mortgage
$92,150
Outstanding Balance
$77,219
Interest Rate
4.03%
Mortgage Type
New Conventional
Estimated Equity
$77,859
Purchase Details
Closed on
Mar 4, 2008
Sold by
Bank Of New York
Bought by
Ramsey Crystal
Purchase Details
Closed on
Nov 10, 2007
Sold by
Northcutt Angela M
Bought by
Bank Of New York
Purchase Details
Closed on
Jul 15, 2005
Sold by
Allen Larry Roger and Allen Mary
Bought by
Northcutt Paul E and Northcutt Angela M
Home Financials for this Owner
Home Financials are based on the most recent Mortgage that was taken out on this home.
Original Mortgage
$71,250
Interest Rate
8.62%
Mortgage Type
Adjustable Rate Mortgage/ARM
Purchase Details
Closed on
Aug 29, 2003
Sold by
Lucille Allen
Bought by
Gary Larry and Gary Allen
Create a Home Valuation Report for This Property
The Home Valuation Report is an in-depth analysis detailing your home's value as well as a comparison with similar homes in the area
Home Values in the Area
Average Home Value in this Area
Purchase History
| Date | Buyer | Sale Price | Title Company |
|---|---|---|---|
| Dingus Alaina | $97,000 | Security Title Service | |
| Ramsey Crystal | $58,000 | -- | |
| Bank Of New York | -- | -- | |
| Northcutt Paul E | $75,000 | -- | |
| Gary Larry | -- | -- |
Source: Public Records
Mortgage History
| Date | Status | Borrower | Loan Amount |
|---|---|---|---|
| Open | Dingus Alaina | $92,150 | |
| Previous Owner | Northcutt Paul E | $71,250 |
Source: Public Records
Tax History Compared to Growth
Tax History
| Year | Tax Paid | Tax Assessment Tax Assessment Total Assessment is a certain percentage of the fair market value that is determined by local assessors to be the total taxable value of land and additions on the property. | Land | Improvement |
|---|---|---|---|---|
| 2024 | $1,148 | $12,121 | $1,663 | $10,458 |
| 2023 | $1,148 | $11,543 | $1,663 | $9,880 |
| 2022 | $1,049 | $11,026 | $1,663 | $9,363 |
| 2021 | $1,055 | $11,026 | $1,663 | $9,363 |
| 2020 | $1,044 | $11,026 | $1,663 | $9,363 |
| 2019 | $1,019 | $10,663 | $1,663 | $9,000 |
| 2018 | $1,033 | $10,670 | $1,663 | $9,007 |
| 2017 | $742 | $8,573 | $1,051 | $7,522 |
| 2016 | $732 | $8,389 | $1,051 | $7,338 |
| 2015 | $711 | $8,144 | $1,051 | $7,093 |
| 2014 | $805 | $8,243 | $1,051 | $7,192 |
Source: Public Records
Map
Nearby Homes
- 1704 Fairway Place
- 3205 Kingston Rd
- 3019 Meadow Ln
- 3013 Kingston Rd
- 1413 Crawford Ave
- 3602 N 14th
- 2612 Meadow Ln
- 2200 Chapel Hill Rd
- 2602 Ridgecrest
- 2211 Turner St
- 2216 El Camino St
- 2208 El Camino St
- TBD 5th and Windsor
- 2205 Cardinal Rd
- 2607 Bluestem Rd
- 3651 N 14th St
- 7525 E Prospect Ave
- 211 E Prospect Ave
- 1150 E Prospect Ave
- 1916 Meadowbrook St
- 1702 Leslie Ln
- 1701 Fairway Place
- 1704 Leslie Ln
- 1703 Fairway Place
- 1615 Shirlee Ave
- 1701 Leslie Ln
- 1703 Leslie Ln
- 1616 Shirlee Ave
- 1705 Fairway Place
- 1705 Leslie Ln
- 1613 Shirlee Ave
- 1706 Leslie Ln
- 1612 Shirlee Ave
- 1707 Fairway Place
- 1708 Leslie Ln
- 1611 Shirlee Ave
- 1707 Leslie Ln
- 1700 Queens Ave
- 1709 Fairway Place
- 1610 Shirlee Ave