Studio
--
Bath
--
Sq Ft
5,576
Sq Ft Lot
About This Home
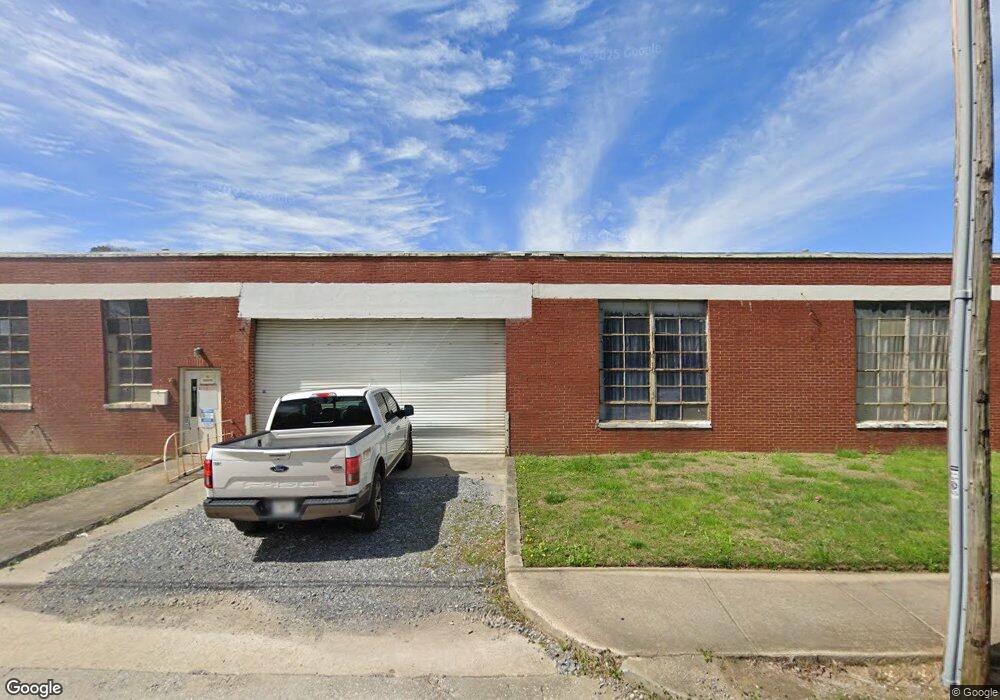
This home is located at 1700 Maple St, Rome, GA 30161. 1700 Maple St is a home located in Floyd County with nearby schools including Rome High School, Darlington School, and St. Mary School.
Ownership History
Date
Name
Owned For
Owner Type
Purchase Details
Closed on
Aug 24, 2018
Sold by
Bubes Associates Llp
Bought by
Echota Realty Co Inc
Purchase Details
Closed on
Dec 1, 1995
Sold by
H O Leasing Inc
Bought by
Bubes Associates Llp
Purchase Details
Closed on
Jun 1, 1988
Sold by
Seal Donna Seal Donna Seal Donna
Bought by
H O Leasing Inc
Purchase Details
Closed on
Nov 27, 1984
Sold by
Clemmons W M Clemmons W M Clemmons W M
Bought by
Seal Donna Seal Donna Seal Donna
Purchase Details
Closed on
Jun 8, 1983
Sold by
Roberts Gary Roberts Gary Roberts Gary
Bought by
Clemmons W M Clemmons W M Clemmons
Purchase Details
Closed on
Jul 4, 1977
Sold by
Roberts Gary and Grady Roberts Gary
Bought by
Roberts Gary Roberts Gary Roberts G
Purchase Details
Closed on
Jul 31, 1972
Sold by
Hardy Wilson M Hardy Wilson M Hardy
Bought by
Roberts Gary and Grady Roberts Gary
Purchase Details
Closed on
Jun 6, 1963
Sold by
Turner W T Turner W T Turner W T
Bought by
Hardy Wilson M Hardy Wilson M Hardy
Purchase Details
Closed on
Jan 1, 1901
Bought by
Turner W T Turner W T Turner W T
Create a Home Valuation Report for This Property
The Home Valuation Report is an in-depth analysis detailing your home's value as well as a comparison with similar homes in the area
Home Values in the Area
Average Home Value in this Area
Purchase History
| Date | Buyer | Sale Price | Title Company |
|---|---|---|---|
| Echota Realty Co Inc | $140,000 | -- | |
| Bubes Associates Llp | $550,000 | -- | |
| H O Leasing Inc | -- | -- | |
| Seal Donna Seal Donna Seal Donna | $9,000 | -- | |
| Clemmons W M Clemmons W M Clemmons | $10,200 | -- | |
| Roberts Gary Roberts Gary Roberts G | -- | -- | |
| Roberts Gary | $9,000 | -- | |
| Hardy Wilson M Hardy Wilson M Hardy | $6,500 | -- | |
| Turner W T Turner W T Turner W T | -- | -- |
Source: Public Records
Tax History
| Year | Tax Paid | Tax Assessment Tax Assessment Total Assessment is a certain percentage of the fair market value that is determined by local assessors to be the total taxable value of land and additions on the property. | Land | Improvement |
|---|---|---|---|---|
| 2025 | $132 | $3,703 | $3,703 | $0 |
| 2024 | $132 | $3,703 | $3,703 | $0 |
| 2023 | $131 | $3,703 | $3,703 | $0 |
| 2022 | $51 | $1,409 | $1,409 | $0 |
| 2021 | $52 | $1,409 | $1,409 | $0 |
| 2020 | $107 | $3,366 | $3,366 | $0 |
| 2019 | $52 | $3,366 | $3,366 | $0 |
| 2018 | $125 | $3,366 | $3,366 | $0 |
| 2017 | $125 | $3,366 | $3,366 | $0 |
| 2016 | $125 | $3,360 | $3,360 | $0 |
| 2015 | $118 | $3,360 | $3,360 | $0 |
| 2014 | $118 | $3,360 | $3,360 | $0 |
Source: Public Records
Map
Nearby Homes
- 39 E 16th St SW
- 1705 Olmstead St SW
- 407 E 18th St SW
- 407 E 19th St SW
- 304 E 19th St SW
- 421 Cedar Ave SW
- 2009 Hull Ave SW
- 170 E 11th St SW
- 10 Lumber St SW
- 168 E 11th St SE
- 164 E 11th St SE
- 162 E 11th St SE
- 803/805 Maple Ave SW
- 803/80 Maple Ave SW
- 1011 Walnut Ave SW
- 166 E 11th St SW
- 118 Hosea St SW
- 201 E 10th St SW
- 31 Notasulga Dr SW
- 2 E 10th St SW
- 405 Strand St SW
- 0 E 17th St Unit 5803293
- 0 E 17th St Unit 20167343
- 0 E 17th St Unit 20167532
- 409 E 17th St
- E E 17th St Unit 190
- E E 17th St Unit 189
- E E 17th St Unit 148
- 410 E 17th St Unit 189
- E E 17th St
- 1609 Maple Ave SE
- 1609 Maple Ave SW
- 1611 Maple Ave SW
- 1701 Maple Ave SW
- 14 E 16th St SW
- 401 Strand St SW
- 302 E 17th St SW
- 303 E 17th St SW
- 1700 Maple Ave SW
- 1700 Maple Ave SW
Your Personal Tour Guide
Ask me questions while you tour the home.