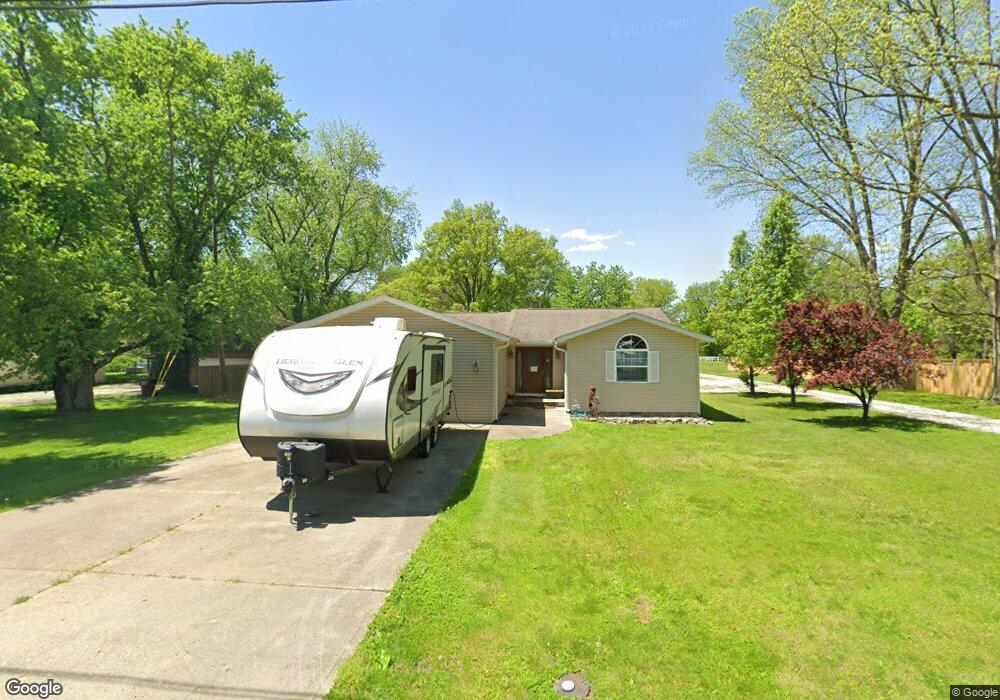
1700 N Stop 18 St Unit Spetler Sub Lot 1 Terre Haute, IN 47803
Estimated Value: $194,000 - $276,000
3
Beds
2
Baths
1,596
Sq Ft
$154/Sq Ft
Est. Value
About This Home
This home is located at 1700 N Stop 18 St Unit Spetler Sub Lot 1, Terre Haute, IN 47803 and is currently estimated at $246,374, approximately $154 per square foot. 1700 N Stop 18 St Unit Spetler Sub Lot 1 is a home located in Vigo County with nearby schools including Lost Creek Elementary School, Woodrow Wilson Middle School, and Terre Haute North Vigo High School.
Ownership History
Date
Name
Owned For
Owner Type
Purchase Details
Closed on
Sep 9, 2020
Sold by
Crumrin Jason R and Crumrin Nichole A
Bought by
Ellington Jessica A and Ellington Dwan T
Current Estimated Value
Home Financials for this Owner
Home Financials are based on the most recent Mortgage that was taken out on this home.
Original Mortgage
$140,000
Outstanding Balance
$124,241
Interest Rate
2.9%
Mortgage Type
New Conventional
Estimated Equity
$122,133
Purchase Details
Closed on
Dec 29, 2006
Sold by
Kayjay Llc
Bought by
Crumrin Jason R and Crumrin Nichole A
Home Financials for this Owner
Home Financials are based on the most recent Mortgage that was taken out on this home.
Original Mortgage
$79,920
Interest Rate
6.24%
Mortgage Type
New Conventional
Create a Home Valuation Report for This Property
The Home Valuation Report is an in-depth analysis detailing your home's value as well as a comparison with similar homes in the area
Home Values in the Area
Average Home Value in this Area
Purchase History
| Date | Buyer | Sale Price | Title Company |
|---|---|---|---|
| Ellington Jessica A | -- | None Available | |
| Crumrin Jason R | -- | None Available |
Source: Public Records
Mortgage History
| Date | Status | Borrower | Loan Amount |
|---|---|---|---|
| Open | Ellington Jessica A | $140,000 | |
| Previous Owner | Crumrin Jason R | $79,920 |
Source: Public Records
Tax History Compared to Growth
Tax History
| Year | Tax Paid | Tax Assessment Tax Assessment Total Assessment is a certain percentage of the fair market value that is determined by local assessors to be the total taxable value of land and additions on the property. | Land | Improvement |
|---|---|---|---|---|
| 2024 | $1,766 | $164,800 | $9,500 | $155,300 |
| 2023 | $2,084 | $194,200 | $9,500 | $184,700 |
| 2022 | $1,939 | $180,100 | $9,500 | $170,600 |
| 2021 | $1,803 | $167,800 | $9,300 | $158,500 |
| 2020 | $1,826 | $144,200 | $9,000 | $135,200 |
| 2019 | $1,814 | $143,000 | $8,900 | $134,100 |
| 2018 | $2,510 | $139,200 | $8,600 | $130,600 |
| 2017 | $1,463 | $165,200 | $9,000 | $156,200 |
| 2016 | $1,229 | $122,900 | $8,600 | $114,300 |
| 2014 | $1,088 | $116,100 | $8,100 | $108,000 |
| 2013 | $1,088 | $118,400 | $8,200 | $110,200 |
Source: Public Records
Map
Nearby Homes
- 9763 E Ohio Ave
- 2196 3rd St
- 2011 N Chamberlain St
- 8133 E Gospel Grove Ave
- 10080 U S Highway 40
- 7990 E Gospel Grove Ave
- 11 Soules St
- 8117 Hannah Ave
- 8026 Hannah Ave
- 8041 Eastland Ct
- 680 N Chamberlain St
- 10691 E Us Highway 40
- 10700 E Us Highway 40
- 10147 N Limberlost Ct
- 9754 Old Orchard Ct
- 9664 Bella Vista Ct
- 9652 Bella Vista Ct
- 9688 Bella Vista Ct
- 9676 Bella Vista Ct
- 6259 Woodhill Ln
- 1700 N Stop 18 St
- 1700 N Unit 18 St
- 1681 N Stop 18 St
- 1727 N Stop 18 St
- 1694 N Stop 18 St
- 1746 N Stop 18 St
- 1745 N Stop 18 St
- 1623 N Stop 18 St
- 9173 E Gobblers Knob Ave
- 1570 N Stop 18 St
- 1799 N Stop 18 St
- 9144 E Gobblers Knob Ave
- 1622 N Stop 18 St
- 1695 Gobblers Knob Rd
- 1711 Gobblers Knob Rd
- 1516 N Stop 18 St
- 1733 Gobblers Knob Rd
- 1750 N Stop 18 St
- 1551 N Stop 18 St
- 9160 E Gobblers Knob Ave