Estimated Value: $165,000 - $183,725
3
Beds
1
Bath
999
Sq Ft
$174/Sq Ft
Est. Value
About This Home
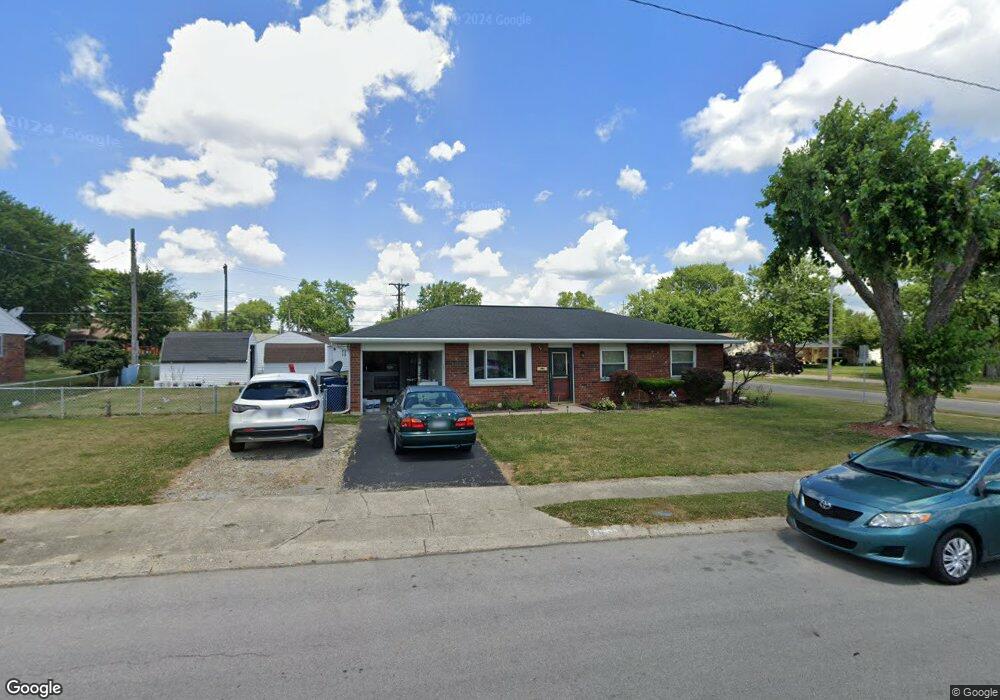
This home is located at 1700 New Haven Rd, Piqua, OH 45356 and is currently estimated at $173,431, approximately $173 per square foot. 1700 New Haven Rd is a home located in Miami County with nearby schools including Washington Primary School, Piqua Junior High School, and Piqua High School.
Ownership History
Date
Name
Owned For
Owner Type
Purchase Details
Closed on
May 27, 2022
Sold by
Cromwell Richard and Cromwell Darryl
Bought by
Zheng Ci Qiang
Current Estimated Value
Home Financials for this Owner
Home Financials are based on the most recent Mortgage that was taken out on this home.
Original Mortgage
$120,000
Outstanding Balance
$113,908
Interest Rate
5%
Mortgage Type
New Conventional
Estimated Equity
$59,523
Purchase Details
Closed on
Feb 12, 2020
Sold by
Cromwell Everett
Bought by
Cromwell Daryl and Cromwell Richard
Purchase Details
Closed on
Nov 14, 2007
Sold by
Cromwell Everett
Bought by
Cromwell Everett and Cromwell Carla J
Purchase Details
Closed on
Sep 6, 1995
Sold by
Cozad Craig S
Bought by
Cromwell Everett
Home Financials for this Owner
Home Financials are based on the most recent Mortgage that was taken out on this home.
Original Mortgage
$63,250
Interest Rate
7.76%
Mortgage Type
New Conventional
Create a Home Valuation Report for This Property
The Home Valuation Report is an in-depth analysis detailing your home's value as well as a comparison with similar homes in the area
Home Values in the Area
Average Home Value in this Area
Purchase History
| Date | Buyer | Sale Price | Title Company |
|---|---|---|---|
| Zheng Ci Qiang | -- | None Listed On Document | |
| Cromwell Daryl | -- | None Available | |
| Cromwell Everett | -- | -- | |
| Cromwell Everett | $63,900 | -- |
Source: Public Records
Mortgage History
| Date | Status | Borrower | Loan Amount |
|---|---|---|---|
| Open | Zheng Ci Qiang | $120,000 | |
| Previous Owner | Cromwell Everett | $63,250 |
Source: Public Records
Tax History Compared to Growth
Tax History
| Year | Tax Paid | Tax Assessment Tax Assessment Total Assessment is a certain percentage of the fair market value that is determined by local assessors to be the total taxable value of land and additions on the property. | Land | Improvement |
|---|---|---|---|---|
| 2024 | $1,798 | $43,750 | $9,450 | $34,300 |
| 2023 | $1,798 | $43,750 | $9,450 | $34,300 |
| 2022 | $1,829 | $43,750 | $9,450 | $34,300 |
| 2021 | $1,482 | $32,410 | $7,000 | $25,410 |
| 2020 | $1,452 | $32,410 | $7,000 | $25,410 |
| 2019 | $1,460 | $32,410 | $7,000 | $25,410 |
| 2018 | $1,293 | $27,410 | $6,830 | $20,580 |
| 2017 | $1,309 | $27,410 | $6,830 | $20,580 |
| 2016 | $1,295 | $27,410 | $6,830 | $20,580 |
| 2015 | $902 | $27,410 | $6,830 | $20,580 |
| 2014 | $902 | $27,410 | $6,830 | $20,580 |
| 2013 | $905 | $27,410 | $6,830 | $20,580 |
Source: Public Records
Map
Nearby Homes
- 806 Candlewood Blvd
- 918 Falmouth Ave
- 914 Briarcliff Ave
- 920 New Haven Rd
- 403 Brentwood Ave
- 1505 Amherst Ave
- 1513 Arrowhead Dr
- 1502 Arrowhead Dr
- Ironwood Plan at Arrowhead Estates
- Juniper Plan at Arrowhead Estates
- Spruce Plan at Arrowhead Estates
- Aspen II Plan at Arrowhead Estates
- Norway Plan at Arrowhead Estates
- Palmetto Plan at Arrowhead Estates
- Walnut Plan at Arrowhead Estates
- Ashton Plan at Arrowhead Estates
- Empress Plan at Arrowhead Estates
- Chestnut Plan at Arrowhead Estates
- Bradford Plan at Arrowhead Estates
- Cooper Plan at Arrowhead Estates
- 1702 New Haven Rd
- 1703 New Haven Rd
- 900 Candlewood Blvd
- 1704 New Haven Rd
- 1705 New Haven Rd
- 802 Candlewood Blvd
- 1706 New Haven Rd
- 1703 South St
- 807 Candlewood Blvd
- 1705 South St
- 901 Candlewood Blvd
- 903 Woodbridge Ct
- 902 Candlewood Blvd
- 805 Candlewood Blvd
- 1708 New Haven Rd
- 1622 New Haven Rd
- 1709 South St
- 1701 South St
- 1619 New Haven Rd
- 803 Candlewood Blvd