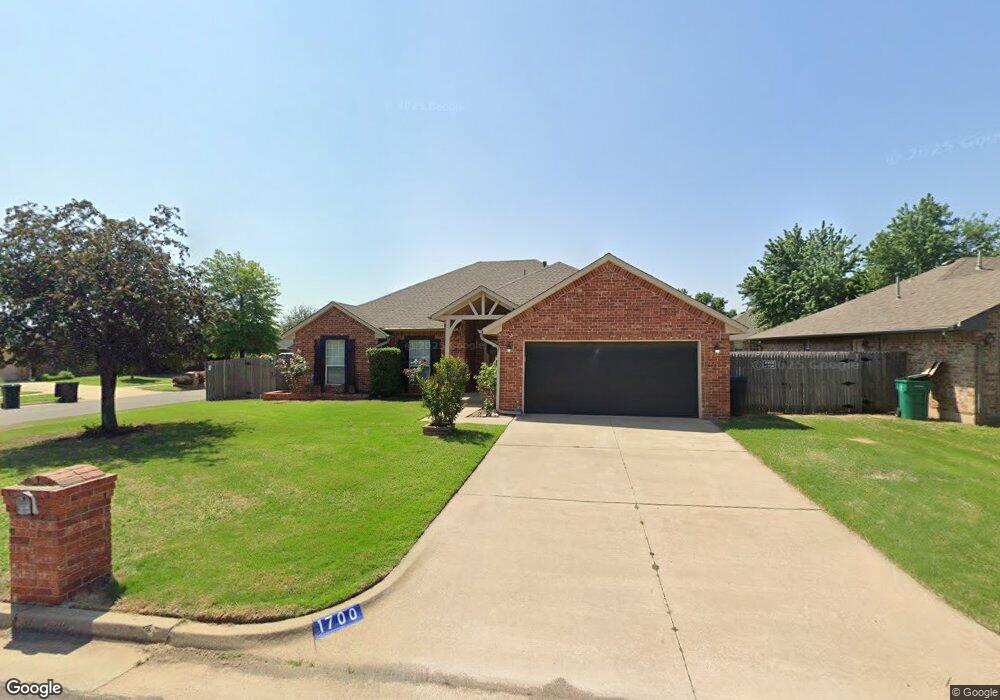
1700 NW 173rd St Edmond, OK 73012
Copper Creek NeighborhoodEstimated Value: $283,000 - $295,144
3
Beds
2
Baths
1,982
Sq Ft
$146/Sq Ft
Est. Value
About This Home
This home is located at 1700 NW 173rd St, Edmond, OK 73012 and is currently estimated at $289,286, approximately $145 per square foot. 1700 NW 173rd St is a home located in Oklahoma County with nearby schools including West Field Elementary School, Heartland Middle School, and Santa Fe High School.
Ownership History
Date
Name
Owned For
Owner Type
Purchase Details
Closed on
Jul 24, 2020
Sold by
Mann Dawn M and Mann Robin K
Bought by
Mann Robin K
Current Estimated Value
Home Financials for this Owner
Home Financials are based on the most recent Mortgage that was taken out on this home.
Original Mortgage
$153,837
Outstanding Balance
$135,638
Interest Rate
2.8%
Mortgage Type
New Conventional
Estimated Equity
$153,648
Purchase Details
Closed on
Dec 22, 2018
Sold by
Mann Robin K
Bought by
Mann Dawn M and Mann Robin K
Purchase Details
Closed on
Nov 30, 2018
Sold by
Mann Robin K
Bought by
Mann Dawn M and Mann Robin K
Purchase Details
Closed on
Oct 15, 2018
Sold by
Mann Dawn
Bought by
Mann Robin
Purchase Details
Closed on
Jun 28, 2013
Sold by
Jones Chance N and Jones Stefanie K
Bought by
Mann Robin and Mann Dawn M
Home Financials for this Owner
Home Financials are based on the most recent Mortgage that was taken out on this home.
Original Mortgage
$169,820
Interest Rate
3.94%
Mortgage Type
FHA
Purchase Details
Closed on
Aug 31, 2006
Sold by
Mcclain Craig and Mcclain Stephanie
Bought by
Jones Chance N and Jones Stefanie K
Home Financials for this Owner
Home Financials are based on the most recent Mortgage that was taken out on this home.
Original Mortgage
$17,200
Interest Rate
6.64%
Mortgage Type
Unknown
Purchase Details
Closed on
Aug 18, 2004
Sold by
Cendant Mobility Financial Corp
Bought by
Mcclain Craig and Mcclain Stephanie
Home Financials for this Owner
Home Financials are based on the most recent Mortgage that was taken out on this home.
Original Mortgage
$141,500
Interest Rate
6%
Mortgage Type
New Conventional
Purchase Details
Closed on
Aug 17, 2004
Sold by
Hare Alan M and Hare Denise L
Bought by
Cendant Mobility Financial Corp
Home Financials for this Owner
Home Financials are based on the most recent Mortgage that was taken out on this home.
Original Mortgage
$141,500
Interest Rate
6%
Mortgage Type
New Conventional
Purchase Details
Closed on
Mar 29, 2002
Sold by
Crane David Stuart
Bought by
Hare Alan M and Hare Denise L
Purchase Details
Closed on
Nov 17, 2000
Sold by
Williams Jolynn and Williams Mike David
Bought by
Crane David Stuart
Purchase Details
Closed on
Nov 24, 1999
Sold by
Jf Homes Inc
Bought by
Williams Jolyn
Home Financials for this Owner
Home Financials are based on the most recent Mortgage that was taken out on this home.
Original Mortgage
$92,750
Interest Rate
7.88%
Purchase Details
Closed on
Jun 2, 1998
Sold by
Copper L L C
Bought by
J F Homes Inc
Create a Home Valuation Report for This Property
The Home Valuation Report is an in-depth analysis detailing your home's value as well as a comparison with similar homes in the area
Home Values in the Area
Average Home Value in this Area
Purchase History
| Date | Buyer | Sale Price | Title Company |
|---|---|---|---|
| Mann Robin K | -- | None Available | |
| Mann Dawn M | -- | None Available | |
| Mann Dawn M | -- | None Available | |
| Mann Robin | -- | None Available | |
| Mann Robin | $86,500 | None Available | |
| Jones Chance N | $172,000 | Capitol Abstract & Title | |
| Mcclain Craig | $156,500 | Oklahoma Title & Closing Co | |
| Cendant Mobility Financial Corp | $156,500 | Oklahoma Title & Closing Co | |
| Hare Alan M | $138,000 | Lawyers Title | |
| Crane David Stuart | $140,000 | American Guaranty Title Co | |
| Williams Jolyn | $132,500 | -- | |
| J F Homes Inc | $16,500 | -- |
Source: Public Records
Mortgage History
| Date | Status | Borrower | Loan Amount |
|---|---|---|---|
| Open | Mann Robin K | $153,837 | |
| Closed | Mann Robin | $169,820 | |
| Previous Owner | Jones Chance N | $17,200 | |
| Previous Owner | Jones Chance N | $137,600 | |
| Previous Owner | Mcclain Craig | $141,500 | |
| Previous Owner | Williams Jolyn | $92,750 |
Source: Public Records
Tax History Compared to Growth
Tax History
| Year | Tax Paid | Tax Assessment Tax Assessment Total Assessment is a certain percentage of the fair market value that is determined by local assessors to be the total taxable value of land and additions on the property. | Land | Improvement |
|---|---|---|---|---|
| 2024 | $2,925 | $25,804 | $3,660 | $22,144 |
| 2023 | $2,925 | $24,576 | $3,666 | $20,910 |
| 2022 | $2,811 | $23,405 | $4,064 | $19,341 |
| 2021 | $2,650 | $22,291 | $4,391 | $17,900 |
| 2020 | $2,561 | $21,230 | $3,987 | $17,243 |
| 2019 | $2,529 | $20,845 | $3,987 | $16,858 |
| 2018 | $2,450 | $20,075 | $0 | $0 |
| 2017 | $2,462 | $20,294 | $3,987 | $16,307 |
| 2016 | $2,422 | $20,074 | $3,651 | $16,423 |
| 2015 | $2,403 | $19,806 | $3,651 | $16,155 |
| 2014 | $2,327 | $19,225 | $3,651 | $15,574 |
Source: Public Records
Map
Nearby Homes
- 17500 Iron Ln
- 2225 NW 171st St
- 2233 NW 171st St
- 2229 NW 171st St
- 2221 NW 171st St
- 2217 NW 171st St
- 2213 NW 171st St
- 2209 NW 171st St
- 1700 NW 171st St
- 2101 NW 171st St
- 17413 Platinum Ln
- 17612 Brass Dr
- 17117 Platinum Ln
- 17412 Mercury Ln
- 2304 NW 170th St
- 2300 NW 170th St
- 2244 NW 170th St
- 2240 NW 170th St
- 2236 NW 170th St
- 2232 NW 170th St
- 1704 NW 173rd St
- 1701 NW 172nd St
- 1705 NW 172nd St
- 1708 NW 173rd St
- 17312 Iron Ln
- 17316 Iron Ln
- 1701 NW 173rd St
- 1705 NW 173rd St
- 17308 Iron Ln
- 17400 Iron Ln
- 1712 NW 173rd St
- 1709 NW 173rd St
- 17304 Iron Ln
- 17404 Iron Ln
- 1713 NW 172nd St
- 17313 Melville Ln
- 1713 NW 173rd St
- 1704 NW 172nd St
- 1700 NW 174th St
- 1716 NW 173rd St