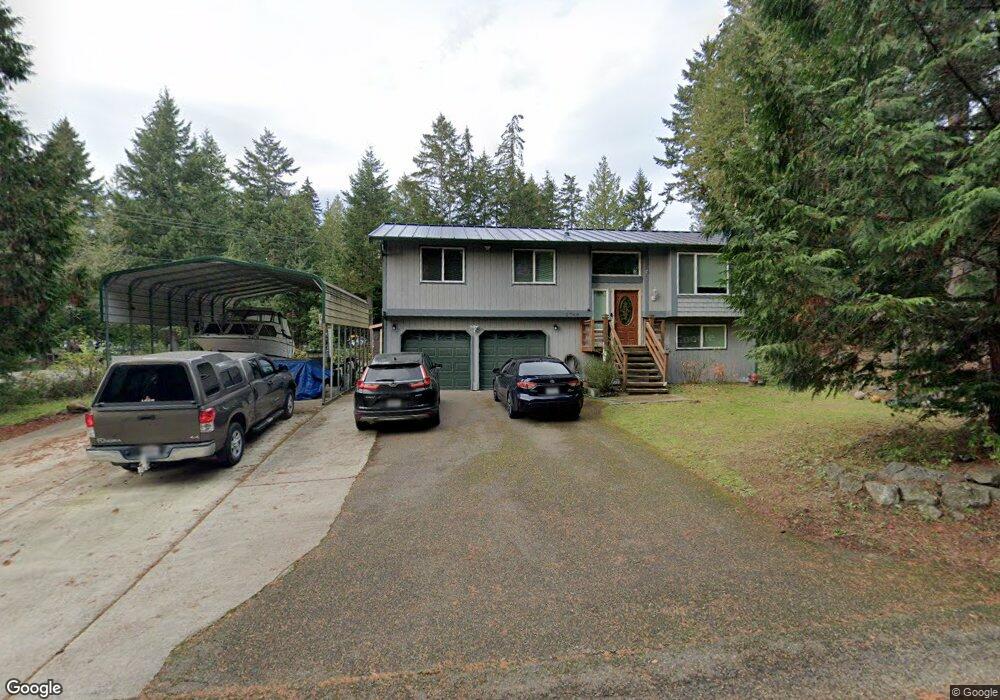
1700 NW Hidden Place Silverdale, WA 98383
Estimated Value: $482,000 - $536,000
3
Beds
2
Baths
1,060
Sq Ft
$486/Sq Ft
Est. Value
About This Home
This home is located at 1700 NW Hidden Place, Silverdale, WA 98383 and is currently estimated at $515,414, approximately $486 per square foot. 1700 NW Hidden Place is a home located in Kitsap County with nearby schools including Emerald Heights Elementary School, Ridgetop Middle School, and Central Kitsap High School.
Ownership History
Date
Name
Owned For
Owner Type
Purchase Details
Closed on
Jun 13, 2002
Sold by
Bank One Na
Bought by
Nguyen Huey T and Ong Tien My
Current Estimated Value
Home Financials for this Owner
Home Financials are based on the most recent Mortgage that was taken out on this home.
Original Mortgage
$151,980
Outstanding Balance
$63,942
Interest Rate
6.74%
Mortgage Type
VA
Estimated Equity
$451,472
Purchase Details
Closed on
Jan 21, 2002
Sold by
Lentz Lonny F and Lentz Salvacion M
Bought by
Bank One Na
Purchase Details
Closed on
May 12, 1997
Sold by
Berkman James D and Berkman Brook
Bought by
Lentz Lonny F and Lentz Salvacion M
Home Financials for this Owner
Home Financials are based on the most recent Mortgage that was taken out on this home.
Original Mortgage
$114,240
Interest Rate
8.15%
Mortgage Type
VA
Create a Home Valuation Report for This Property
The Home Valuation Report is an in-depth analysis detailing your home's value as well as a comparison with similar homes in the area
Home Values in the Area
Average Home Value in this Area
Purchase History
| Date | Buyer | Sale Price | Title Company |
|---|---|---|---|
| Nguyen Huey T | $150,500 | First American Title Ins | |
| Bank One Na | $121,500 | First American Title Ins | |
| Lentz Lonny F | $112,000 | Land Title Company | |
| Berkman James D | -- | Land Title Company | |
| Quebedeaux Michael J | -- | Land Title Company |
Source: Public Records
Mortgage History
| Date | Status | Borrower | Loan Amount |
|---|---|---|---|
| Open | Nguyen Huey T | $151,980 | |
| Previous Owner | Lentz Lonny F | $114,240 |
Source: Public Records
Tax History Compared to Growth
Tax History
| Year | Tax Paid | Tax Assessment Tax Assessment Total Assessment is a certain percentage of the fair market value that is determined by local assessors to be the total taxable value of land and additions on the property. | Land | Improvement |
|---|---|---|---|---|
| 2026 | $4,296 | $455,070 | $136,590 | $318,480 |
| 2025 | $4,296 | $455,070 | $136,590 | $318,480 |
| 2024 | $4,178 | $455,070 | $136,590 | $318,480 |
| 2023 | $3,932 | $425,770 | $151,690 | $274,080 |
| 2022 | $3,797 | $362,480 | $128,850 | $233,630 |
| 2021 | $3,665 | $333,240 | $117,880 | $215,360 |
| 2020 | $3,353 | $308,440 | $108,740 | $199,700 |
| 2019 | $3,209 | $285,860 | $100,520 | $185,340 |
| 2018 | $3,450 | $230,400 | $79,420 | $150,980 |
| 2017 | $2,962 | $230,400 | $79,420 | $150,980 |
| 2016 | $2,930 | $210,820 | $79,420 | $131,400 |
| 2015 | $2,805 | $210,820 | $79,420 | $131,400 |
| 2014 | -- | $200,170 | $79,420 | $120,750 |
| 2013 | -- | $200,170 | $79,420 | $120,750 |
Source: Public Records
Map
Nearby Homes
- 12698 Plateau Cir NW
- 12281 Ridgepoint Cir NW
- 1330 NW Slate Ln Unit 101
- 1504 NW Lakehill Cir
- 1700 NW Marmot Ct
- 11941 Schold Rd NW
- 13727 Templeton Ave NW
- 11658 Breckenridge Ln NW
- 1603 Seasons Ln NW
- 2149 NW Rustling Fir Ln
- 2074 NW Winterset Ln
- 1995 NW Rustling Fir Ln
- 3303 NW Half Mile Rd
- 1940 NW Rustling Fir Ln
- 13375 Central Valley Rd NE
- 3761 NW Trigger Ave
- 135 Walker Rd NW
- 13387 Calico Place NW
- 0 Greaves Way Unit NWM2347701
- 0 Clear Creek Rd NW
- 1680 NW Hidden Place
- 1685 NW Hidden Place
- 12754 Silverdale Way NW Unit A
- 12754 Silverdale Way NW
- 12754 Silverdale Way NW Unit B
- 1660 NW Hidden Place
- 12674 Silverdale Way NW
- 12691 Silverdale Way NW
- 12764 Silverdale Way NW Unit B
- 12764 Silverdale Way NW
- 1675 NW Hidden Place
- 12698 Silverdale Way NW
- 12807 Springboard Ave NW Unit 6
- 12807 Springboard Ave NW Unit 4
- 12807 Springboard Ave NW Unit 2
- 1655 NW Hidden Place
- 12538 Silverdale Way NW
- 12819 Springboard Ave NW
- 12819 Springboard Ave NW Unit 5
- 1642 NW Vasquez Way