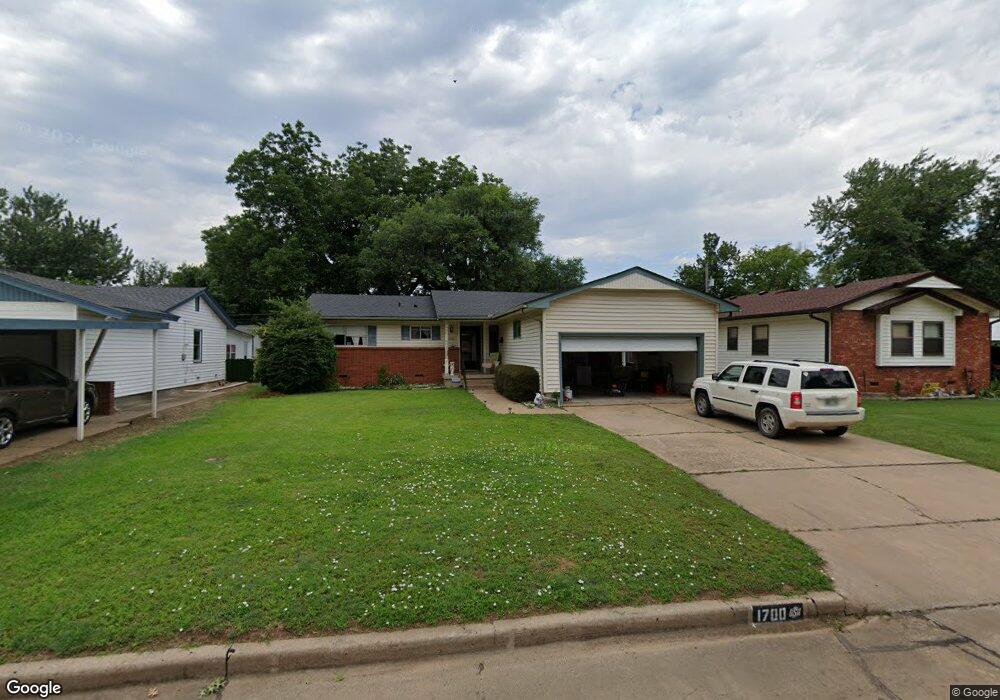
1700 Potomac Dr Ponca City, OK 74601
Estimated Value: $86,000 - $102,000
3
Beds
2
Baths
1,003
Sq Ft
$95/Sq Ft
Est. Value
About This Home
This home is located at 1700 Potomac Dr, Ponca City, OK 74601 and is currently estimated at $95,547, approximately $95 per square foot. 1700 Potomac Dr is a home located in Kay County with nearby schools including Liberty Elementary School, Ponca City West Middle School, and Ponca City East Middle School.
Ownership History
Date
Name
Owned For
Owner Type
Purchase Details
Closed on
Feb 27, 2019
Sold by
Jones Leonard C and Jones Margie
Bought by
Bero Michelle
Current Estimated Value
Purchase Details
Closed on
Sep 14, 2006
Sold by
Ruff Henry A
Bought by
Jones Leonard C and Jones Margie
Home Financials for this Owner
Home Financials are based on the most recent Mortgage that was taken out on this home.
Original Mortgage
$11,640
Interest Rate
6.51%
Mortgage Type
New Conventional
Purchase Details
Closed on
Sep 8, 2006
Sold by
Streeter Mattie Sue and Streeter Glenn E
Bought by
Ruff Henry A
Home Financials for this Owner
Home Financials are based on the most recent Mortgage that was taken out on this home.
Original Mortgage
$11,640
Interest Rate
6.51%
Mortgage Type
New Conventional
Purchase Details
Closed on
Aug 25, 2003
Sold by
Alice Kenneth and Alice Rosewitz
Bought by
Henry Ruff
Create a Home Valuation Report for This Property
The Home Valuation Report is an in-depth analysis detailing your home's value as well as a comparison with similar homes in the area
Home Values in the Area
Average Home Value in this Area
Purchase History
| Date | Buyer | Sale Price | Title Company |
|---|---|---|---|
| Bero Michelle | $65,000 | First American Title Ins Co | |
| Jones Leonard C | $58,200 | -- | |
| Ruff Henry A | -- | -- | |
| Henry Ruff | $52,900 | -- |
Source: Public Records
Mortgage History
| Date | Status | Borrower | Loan Amount |
|---|---|---|---|
| Previous Owner | Jones Leonard C | $11,640 | |
| Previous Owner | Jones Leonard C | $46,560 | |
| Previous Owner | Ruff Henry A | $46,560 |
Source: Public Records
Tax History Compared to Growth
Tax History
| Year | Tax Paid | Tax Assessment Tax Assessment Total Assessment is a certain percentage of the fair market value that is determined by local assessors to be the total taxable value of land and additions on the property. | Land | Improvement |
|---|---|---|---|---|
| 2024 | $746 | $7,883 | $924 | $6,959 |
| 2023 | $746 | $7,508 | $924 | $6,584 |
| 2022 | $680 | $7,150 | $924 | $6,226 |
| 2021 | $684 | $7,150 | $924 | $6,226 |
| 2020 | $677 | $7,150 | $924 | $6,226 |
| 2019 | $531 | $5,553 | $792 | $4,761 |
| 2018 | $536 | $5,534 | $792 | $4,742 |
| 2017 | $552 | $5,637 | $792 | $4,845 |
| 2016 | $568 | $5,740 | $792 | $4,948 |
| 2015 | $591 | $5,943 | $792 | $5,151 |
| 2014 | $578 | $5,922 | $792 | $5,130 |
Source: Public Records
Map
Nearby Homes
- 1616 Potomac Dr
- 1704 Potomac Dr
- 1612 Potomac Dr
- 1701 Richway Dr
- 1617 Richway Dr
- 1705 Richway Dr
- 1701 Potomac Dr
- 1608 Potomac Dr
- 1613 Richway Dr
- 1617 Potomac Dr
- 1712 Potomac Dr
- 1705 Potomac Dr
- 1709 Richway Dr
- 1613 Potomac Dr
- 1609 Richway Dr
- 1709 Potomac Dr
- 1604 Potomac Dr
- 1609 Potomac Dr
- 1713 Richway Dr
- 1800 Potomac Dr