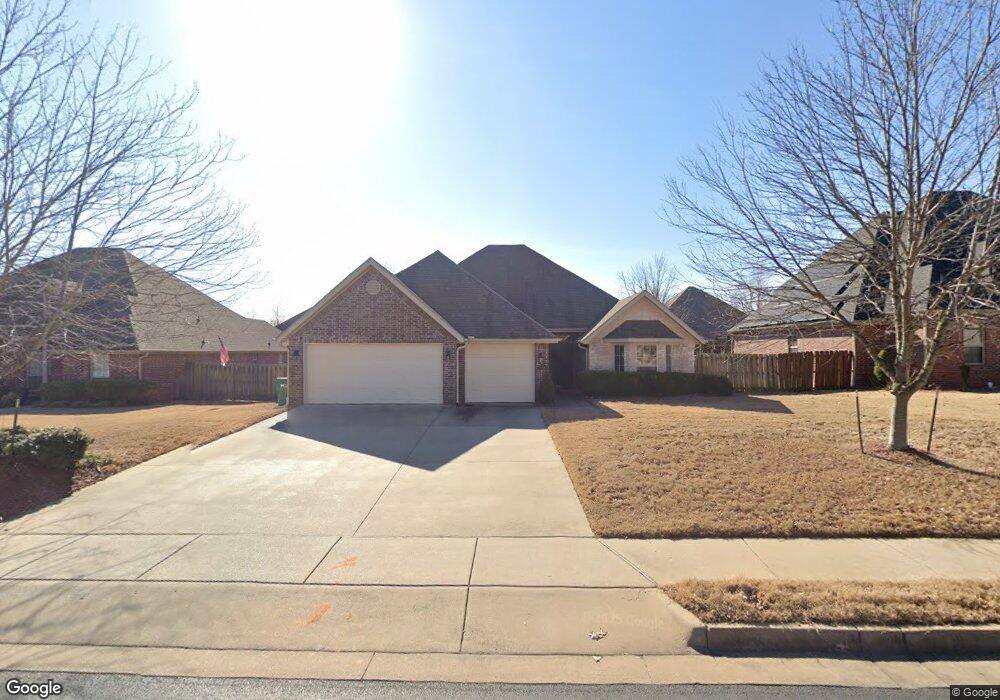
1700 Quailridge Way Bentonville, AR 72713
Estimated Value: $495,761 - $577,000
--
Bed
1
Bath
2,234
Sq Ft
$234/Sq Ft
Est. Value
About This Home
This home is located at 1700 Quailridge Way, Bentonville, AR 72713 and is currently estimated at $523,690, approximately $234 per square foot. 1700 Quailridge Way is a home with nearby schools including Osage Creek Elementary School, Creekside Middle School, and Grimsley Junior High School.
Ownership History
Date
Name
Owned For
Owner Type
Purchase Details
Closed on
Feb 25, 2022
Sold by
Ham Richard Garrett and Ham Callie Leigh
Bought by
Chr Homes Llc
Current Estimated Value
Home Financials for this Owner
Home Financials are based on the most recent Mortgage that was taken out on this home.
Original Mortgage
$296,250
Outstanding Balance
$276,296
Interest Rate
3.92%
Mortgage Type
New Conventional
Estimated Equity
$247,394
Purchase Details
Closed on
Sep 29, 2010
Sold by
Riggins Properties Inc
Bought by
Ham Richard Garrett and Ham Callie Leigh
Home Financials for this Owner
Home Financials are based on the most recent Mortgage that was taken out on this home.
Original Mortgage
$202,276
Interest Rate
4.25%
Mortgage Type
FHA
Purchase Details
Closed on
Dec 14, 2004
Bought by
Quail Ridge Dev
Create a Home Valuation Report for This Property
The Home Valuation Report is an in-depth analysis detailing your home's value as well as a comparison with similar homes in the area
Home Values in the Area
Average Home Value in this Area
Purchase History
| Date | Buyer | Sale Price | Title Company |
|---|---|---|---|
| Chr Homes Llc | -- | None Listed On Document | |
| Ham Richard Garrett | $205,000 | Rtc | |
| Quail Ridge Dev | -- | -- |
Source: Public Records
Mortgage History
| Date | Status | Borrower | Loan Amount |
|---|---|---|---|
| Open | Chr Homes Llc | $296,250 | |
| Previous Owner | Ham Richard Garrett | $202,276 |
Source: Public Records
Tax History Compared to Growth
Tax History
| Year | Tax Paid | Tax Assessment Tax Assessment Total Assessment is a certain percentage of the fair market value that is determined by local assessors to be the total taxable value of land and additions on the property. | Land | Improvement |
|---|---|---|---|---|
| 2025 | $4,421 | $89,312 | $17,000 | $72,312 |
| 2024 | $4,094 | $89,312 | $17,000 | $72,312 |
| 2023 | $3,722 | $60,320 | $14,000 | $46,320 |
| 2022 | $3,699 | $60,320 | $14,000 | $46,320 |
| 2021 | $3,363 | $60,320 | $14,000 | $46,320 |
| 2020 | $3,102 | $48,770 | $8,400 | $40,370 |
| 2019 | $3,102 | $48,770 | $8,400 | $40,370 |
| 2018 | $3,102 | $48,770 | $8,400 | $40,370 |
| 2017 | $2,254 | $48,770 | $8,400 | $40,370 |
| 2016 | $2,254 | $48,770 | $8,400 | $40,370 |
| 2015 | $2,492 | $40,390 | $4,000 | $36,390 |
| 2014 | $2,142 | $40,390 | $4,000 | $36,390 |
Source: Public Records
Map
Nearby Homes
- 1730 Quailridge Way
- 1740 Partridge Run
- 1621 Ella Place
- 3604 SW Briar Creek Ave
- 3409 SW Windy Oak Ave
- 1721 Cherrie
- 1711 Grace Place
- 3400 SW Briar Creek Ave
- 1621 & 1623 Greenhouse Rd
- 4100 SW Deerfield Blvd
- 3601 SW Willowbrook Rd
- 890 Clark Cir
- 3106 SW Briar Creek Ave
- 1041 Little Osage Ave
- 950 Clark Cir
- 1210 Stoneybrook Ln
- 4502 SW Plumley Ave
- 4102 SW Bermuda Ave
- 971 Osage View Dr
- 3009 SW Waterleaf Ave
- 1700 Quail Ridge Way
- 1700 Quailridge Way
- 1670 Quailridge Way
- 1670 Quail Ridge Way
- 1710 Quail Ridge Way
- 1710 Quailridge Way
- 1701 Foxboro Ct
- 1660 Quailridge Way
- 1671 Foxboro Ct
- 1720 Quailridge Way
- 1660 Quailridge Way
- 1660 Quail Ridge Way
- 1671 Foxboro Ct
- 1711 Foxboro Ct
- 1701 Quailridge Way
- 1701 Quail Ridge Way
- 1671 Quailridge Way
- 1711 Quailridge Way
- 1721 Foxboro Ct
- 1661 Foxboro Ct