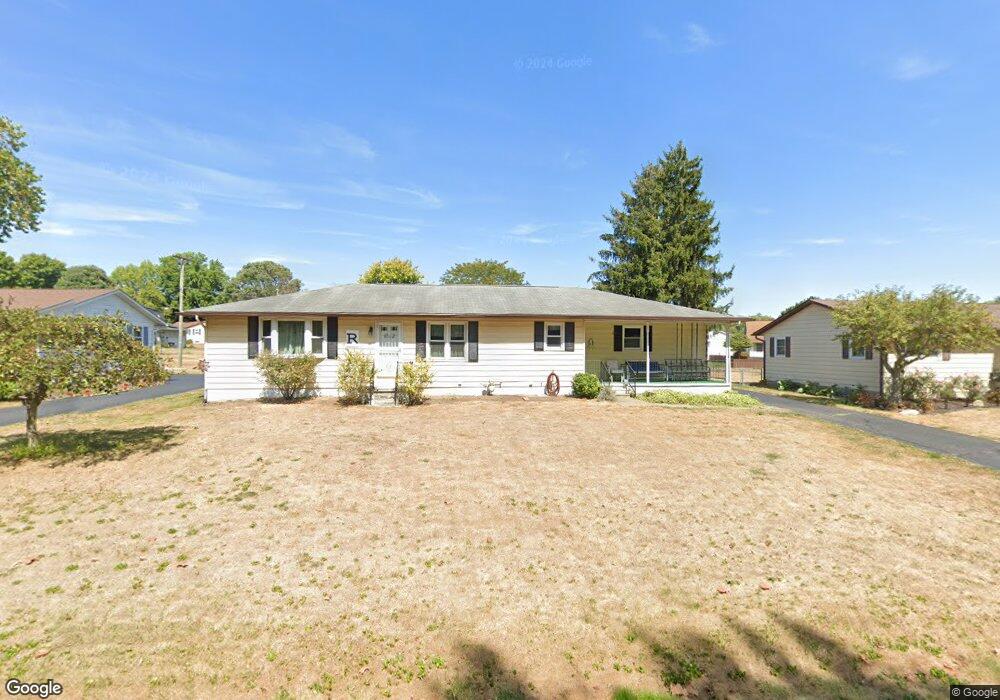
1700 Rainbow Dr NE Lancaster, OH 43130
Estimated Value: $283,000 - $292,000
3
Beds
3
Baths
1,226
Sq Ft
$235/Sq Ft
Est. Value
About This Home
This home is located at 1700 Rainbow Dr NE, Lancaster, OH 43130 and is currently estimated at $288,032, approximately $234 per square foot. 1700 Rainbow Dr NE is a home located in Fairfield County with nearby schools including Medill Elementary School, Thomas Ewing Junior High School, and Lancaster High School.
Ownership History
Date
Name
Owned For
Owner Type
Purchase Details
Closed on
Nov 27, 2019
Sold by
Russell Dianna J and Charles Rager Irrevocable Trus
Bought by
Roberts Dustin T and Roberts Marcee L
Current Estimated Value
Home Financials for this Owner
Home Financials are based on the most recent Mortgage that was taken out on this home.
Original Mortgage
$136,000
Outstanding Balance
$120,254
Interest Rate
3.75%
Mortgage Type
New Conventional
Estimated Equity
$167,778
Purchase Details
Closed on
Feb 28, 2019
Sold by
Rager Charles F
Bought by
Russell Dianna J and Charles Rager Irrevocable Trus
Purchase Details
Closed on
May 21, 2010
Sold by
Henry Hazel Eileen
Bought by
Rager M Lawreta and Rager Charles F
Home Financials for this Owner
Home Financials are based on the most recent Mortgage that was taken out on this home.
Original Mortgage
$131,330
Interest Rate
5.3%
Mortgage Type
FHA
Purchase Details
Closed on
Dec 21, 1995
Sold by
Miller Rose M
Bought by
Henry Silas L and Henry Hazel E
Create a Home Valuation Report for This Property
The Home Valuation Report is an in-depth analysis detailing your home's value as well as a comparison with similar homes in the area
Home Values in the Area
Average Home Value in this Area
Purchase History
| Date | Buyer | Sale Price | Title Company |
|---|---|---|---|
| Roberts Dustin T | $160,000 | Valmer Land Title Agency Box | |
| Russell Dianna J | -- | None Available | |
| Rager M Lawreta | $133,350 | Valmer Land Title Agency | |
| Henry Silas L | $90,000 | -- |
Source: Public Records
Mortgage History
| Date | Status | Borrower | Loan Amount |
|---|---|---|---|
| Open | Roberts Dustin T | $136,000 | |
| Previous Owner | Rager M Lawreta | $131,330 |
Source: Public Records
Tax History Compared to Growth
Tax History
| Year | Tax Paid | Tax Assessment Tax Assessment Total Assessment is a certain percentage of the fair market value that is determined by local assessors to be the total taxable value of land and additions on the property. | Land | Improvement |
|---|---|---|---|---|
| 2024 | $5,609 | $62,390 | $12,530 | $49,860 |
| 2023 | $2,270 | $62,390 | $12,530 | $49,860 |
| 2022 | $2,279 | $62,390 | $12,530 | $49,860 |
| 2021 | $1,952 | $50,070 | $10,920 | $39,150 |
| 2020 | $1,851 | $50,070 | $10,920 | $39,150 |
| 2019 | $1,596 | $53,690 | $10,920 | $42,770 |
| 2018 | $1,504 | $50,540 | $10,920 | $39,620 |
| 2017 | $1,505 | $48,980 | $9,160 | $39,820 |
| 2016 | $1,466 | $48,980 | $9,160 | $39,820 |
| 2015 | $1,444 | $47,220 | $9,160 | $38,060 |
| 2014 | $1,376 | $47,220 | $9,160 | $38,060 |
| 2013 | $1,376 | $47,220 | $9,160 | $38,060 |
Source: Public Records
Map
Nearby Homes
- 1760 Rainbow Dr NE
- 0 Old Millersport Rd NE Unit Lot 10 225033491
- 0 Old Millersport Rd NE Unit 225010386
- 0 Old Millersport Rd NE Unit Tract 8 224028101
- 2444 Sheridan Dr
- 1976 Breed Hill Ct
- 1669 Lexington Dr
- 0 Declaration Dr W Unit 219044159
- 0 Lucille Dr NE
- 1700 Rosewood Dr NE
- 1523 Fuller Ct
- 2149 Pleasantview Dr NE
- 1801 Pleasantview Dr NE
- 2010 Ridgebrook Rd
- 715 Sherman Bluff Way Unit 14715
- 2961 Old Millersport Rd NE
- 706 Sherman Bluff Way Unit 1706
- 3155 Old Millersport Rd NE
- 3155 Old Millersport Rd NE Unit Lot 11
- 1916 Country Place
- 1700 Rainbow Dr NE
- 1710 Rainbow Dr NE
- 1720 Rainbow Dr NE
- 2330 Seville St
- 1680 Rainbow Dr NE
- 1715 Rainbow Dr NE
- 1730 Rainbow Dr NE
- 1707 Rainbow Dr NE
- 1727 Rainbow Dr NE
- 2335 Seville St
- 2334 Seville St
- 1687 Rainbow Dr NE
- 1670 Rainbow Dr NE
- 2220 Sheridan Dr
- 2472 Beverly Hills Dr
- 1751 Rainbow Dr NE
- 1673 Rainbow Dr NE
- 2230 Sheridan Dr
- 2340 Seville St
- 2341 Seville St