j
Seller's Agent in 2015
joe hurwitz
Hurwitz Enterprises
(217) 899-4003
5 Total Sales

Estimated Value: $83,000 - $106,386
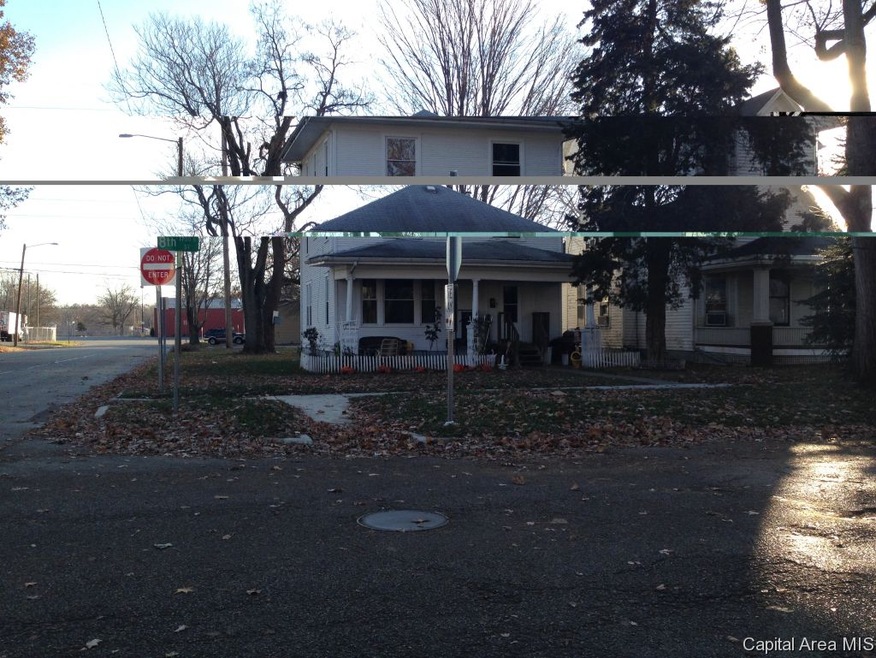
Part of 14 property income producing section 8 portfolio. Can be purchased individually or as whole. This property generates $725 in monthly income.
Last Agent to Sell the Property
Hurwitz Enterprises License #471016904 Listed on: 08/01/2014
Last Buyer's Agent
JOSH VEHOVIC
IN BETWEEN OFFICES License #471005659
| Date | Buyer | Sale Price | Title Company |
|---|---|---|---|
| -- | $62,000 | -- |
| Date | Event | Price | List to Sale | Price per Sq Ft |
|---|---|---|---|---|
| 01/21/2015 01/21/15 | Sold | $10,507 | -82.2% | -- |
| 12/22/2014 12/22/14 | Pending | -- | -- | -- |
| 08/01/2014 08/01/14 | For Sale | $58,875 | -- | -- |
| Year | Tax Paid | Tax Assessment Tax Assessment Total Assessment is a certain percentage of the fair market value that is determined by local assessors to be the total taxable value of land and additions on the property. | Land | Improvement |
|---|---|---|---|---|
| 2024 | $2,049 | $24,392 | $3,072 | $21,320 |
| 2023 | $1,970 | $22,280 | $2,806 | $19,474 |
| 2022 | $1,894 | $21,135 | $2,662 | $18,473 |
| 2021 | $1,831 | $20,343 | $2,562 | $17,781 |
| 2020 | $1,795 | $20,374 | $2,566 | $17,808 |
| 2019 | $1,761 | $20,303 | $2,557 | $17,746 |
| 2018 | $1,903 | $22,524 | $2,546 | $19,978 |
| 2017 | $1,864 | $22,233 | $2,513 | $19,720 |
| 2016 | $1,827 | $21,908 | $2,476 | $19,432 |
| 2015 | $1,308 | $21,646 | $2,446 | $19,200 |
| 2014 | $1,285 | $21,506 | $2,430 | $19,076 |
| 2013 | $1,256 | $21,506 | $2,430 | $19,076 |
j
Seller's Agent in 2015
joe hurwitz
Hurwitz Enterprises
(217) 899-4003
5 Total Sales
J
Buyer's Agent in 2015
JOSH VEHOVIC
IN BETWEEN OFFICES
Source: RMLS Alliance
MLS Number: RMACA145499
APN: 22-03.0-129-001
Disclaimer: Certain information contained herein is derived from information provided by parties other than Homes.com. All information provided is deemed reliable, but is not guaranteed to be accurate and should be independently verified.
![]() Based on information submitted to the MLS GRID. All data is obtained from various sources and may not have been verified by broker or MLS GRID. Supplied Open House Information is subject to change without notice. All information should be independently reviewed and verified for accuracy. Properties may or may not be listed by the office/agent presenting the information. Some IDX listings have been excluded from this website.IDX information is provided exclusively for personal, non-commercial use, and may not be used for any purpose other than to identify prospective properties consumers may be interested in purchasing. Information is deemed reliable but not guaranteed.
Based on information submitted to the MLS GRID. All data is obtained from various sources and may not have been verified by broker or MLS GRID. Supplied Open House Information is subject to change without notice. All information should be independently reviewed and verified for accuracy. Properties may or may not be listed by the office/agent presenting the information. Some IDX listings have been excluded from this website.IDX information is provided exclusively for personal, non-commercial use, and may not be used for any purpose other than to identify prospective properties consumers may be interested in purchasing. Information is deemed reliable but not guaranteed.
Based on information submitted to the MLS GRID
Ask me questions while you tour the home.
