Estimated Value: $159,792 - $185,000
--
Bed
--
Bath
910
Sq Ft
$191/Sq Ft
Est. Value
About This Home
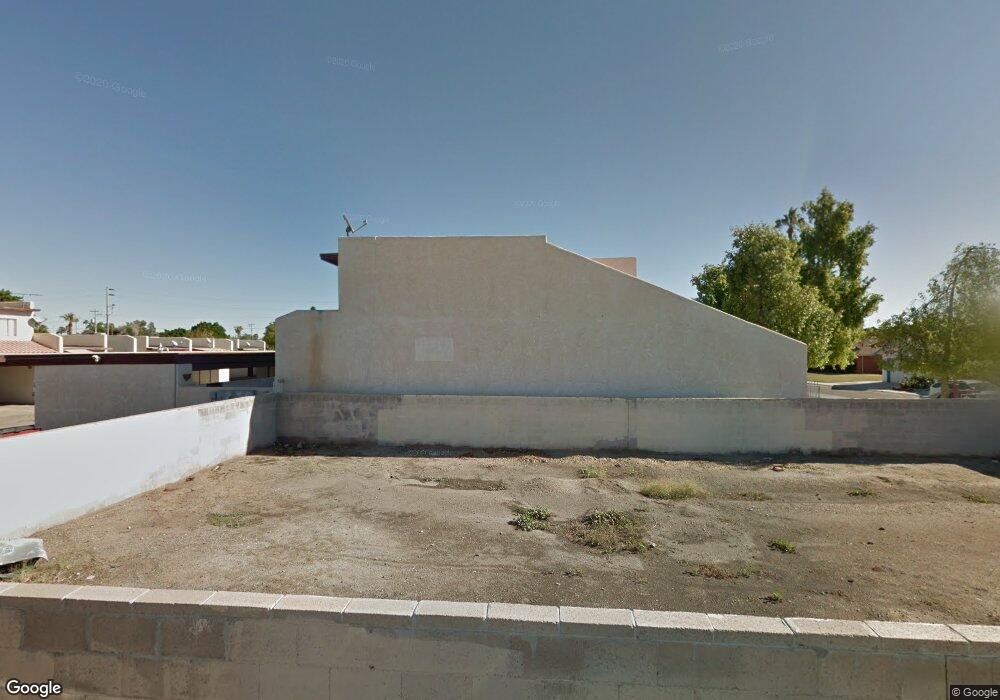
This home is located at 1700 S Crowder Ave Unit 12, Yuma, AZ 85364 and is currently estimated at $173,948, approximately $191 per square foot. 1700 S Crowder Ave Unit 12 is a home located in Yuma County with nearby schools including Salida Del Sol Elementary School, Rancho Viejo Elementary School, and Centennial Middle School.
Ownership History
Date
Name
Owned For
Owner Type
Purchase Details
Closed on
Oct 2, 2025
Sold by
Figueroa Christopher and Garcia Diana Magaly
Bought by
Rodriguez Chase A
Current Estimated Value
Home Financials for this Owner
Home Financials are based on the most recent Mortgage that was taken out on this home.
Original Mortgage
$4,860
Outstanding Balance
$4,860
Interest Rate
6.35%
Estimated Equity
$169,088
Purchase Details
Closed on
Apr 6, 2020
Sold by
Figueroa Christopher and Garcia Diana Magaly
Bought by
Figueroa Christopher and Garcia Diana Magaly
Home Financials for this Owner
Home Financials are based on the most recent Mortgage that was taken out on this home.
Original Mortgage
$105,061
Interest Rate
3.62%
Mortgage Type
FHA
Purchase Details
Closed on
Oct 8, 2009
Sold by
Ward William J
Bought by
William J Ward Trust
Purchase Details
Closed on
Apr 28, 2006
Sold by
Marquez Richard Paul and Marquez Helen Kathleen
Bought by
Ward William J and Ward William
Home Financials for this Owner
Home Financials are based on the most recent Mortgage that was taken out on this home.
Original Mortgage
$86,000
Interest Rate
6.56%
Mortgage Type
New Conventional
Create a Home Valuation Report for This Property
The Home Valuation Report is an in-depth analysis detailing your home's value as well as a comparison with similar homes in the area
Home Values in the Area
Average Home Value in this Area
Purchase History
| Date | Buyer | Sale Price | Title Company |
|---|---|---|---|
| Rodriguez Chase A | $165,000 | Chicago Title Agency | |
| Figueroa Christopher | -- | Chicago Title Agency Inc | |
| Figueroa Christopher | $107,000 | Chicago Title Agency | |
| William J Ward Trust | -- | None Available | |
| Ward William J | $119,900 | First American Title |
Source: Public Records
Mortgage History
| Date | Status | Borrower | Loan Amount |
|---|---|---|---|
| Open | Rodriguez Chase A | $4,860 | |
| Open | Rodriguez Chase A | $162,011 | |
| Previous Owner | Figueroa Christopher | $105,061 | |
| Previous Owner | Ward William J | $86,000 |
Source: Public Records
Tax History Compared to Growth
Tax History
| Year | Tax Paid | Tax Assessment Tax Assessment Total Assessment is a certain percentage of the fair market value that is determined by local assessors to be the total taxable value of land and additions on the property. | Land | Improvement |
|---|---|---|---|---|
| 2025 | $886 | $7,279 | $1,451 | $5,828 |
| 2024 | $848 | $6,932 | $1,451 | $5,481 |
| 2023 | $848 | $6,602 | $1,725 | $4,877 |
| 2022 | $827 | $6,288 | $1,664 | $4,624 |
| 2021 | $858 | $5,988 | $1,519 | $4,469 |
| 2020 | $835 | $5,703 | $1,213 | $4,490 |
| 2019 | $821 | $5,432 | $1,175 | $4,257 |
| 2018 | $765 | $5,173 | $1,145 | $4,028 |
| 2017 | $750 | $5,173 | $1,145 | $4,028 |
| 2016 | $734 | $4,692 | $1,105 | $3,587 |
| 2015 | $793 | $4,469 | $1,400 | $3,069 |
| 2014 | $793 | $5,749 | $3,150 | $2,599 |
Source: Public Records
Map
Nearby Homes
- 2229 W 17th St
- 0000 W County 16 3 4 St
- 2545 W 16th St
- 2402 W 16th St Unit E9
- 2402 W 16th St Unit C1
- 2402 W 16th St Unit F9
- 2402 W 16th St Unit F10
- 2402 W 16th St Unit B3
- 2402 W 16th St Unit G12
- 1807 S Pendergast Ave
- 0000 W 16th St
- 2238 W Brook St
- 1887 S Mckinley Ave
- 1380 S 22nd Dr
- 1363 S 24th Ave
- 1900 W 15 St
- 3017 W 17th St
- 2420 W 13th Place
- 3120 W 16th Place
- 1805 S Magnolia Ave
- 1700 S Crowder Ave Unit 10
- 1700 S Crowder Ave Unit 28
- 1700 S Crowder Ave Unit 27
- 1700 S Crowder Ave Unit 26
- 1700 S Crowder Ave Unit 25
- 1700 S Crowder Ave Unit 24
- 1700 S Crowder Ave Unit 23
- 1700 S Crowder Ave Unit 20
- 1700 S Crowder Ave Unit 19
- 1700 S Crowder Ave Unit 18
- 1700 S Crowder Ave Unit 17
- 1700 S Crowder Ave Unit 16
- 1700 S Crowder Ave Unit 15
- 1700 S Crowder Ave Unit 10
- 1700 S Crowder Ave Unit 8
- 1700 S Crowder Ave Unit 7
- 1700 S Crowder Ave Unit 5
- 1700 S Crowder Ave Unit 9
- 1661 S Crowder Ave
- 2235 W 16th Place