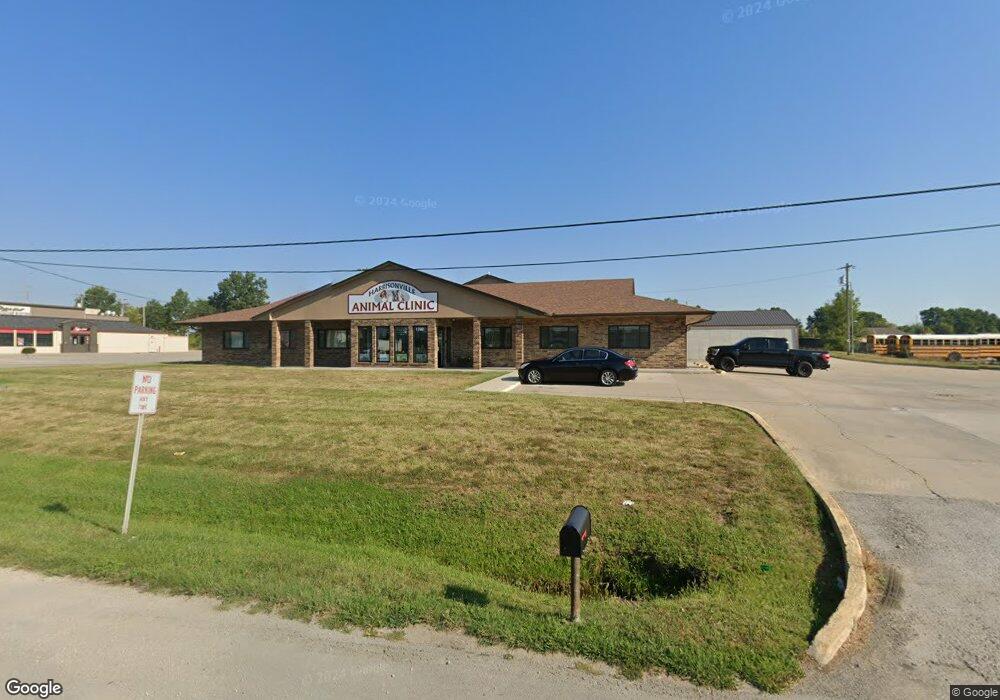
1700 W Mechanic St Harrisonville, MO 64701
--
Bed
--
Bath
8,172
Sq Ft
0.86
Acres
About This Home
This home is located at 1700 W Mechanic St, Harrisonville, MO 64701. 1700 W Mechanic St is a home located in Cass County with nearby schools including McEowen Elementary School, Harrisonville Elementary School, and Harrisonville Middle School.
Ownership History
Date
Name
Owned For
Owner Type
Purchase Details
Closed on
Feb 26, 2021
Sold by
Community Bank Of Raymore
Bought by
Christensen Jan J and Christensen Holly L
Purchase Details
Closed on
Oct 15, 2019
Sold by
Plunkett Brandon S and Plunkett Heather I
Bought by
Community Bank Of Raymore
Purchase Details
Closed on
Jul 23, 2014
Sold by
Commerce Bank
Bought by
Plunkett Brandon S and Plunkett Heather I
Home Financials for this Owner
Home Financials are based on the most recent Mortgage that was taken out on this home.
Original Mortgage
$15,900
Interest Rate
4.23%
Mortgage Type
Future Advance Clause Open End Mortgage
Purchase Details
Closed on
Mar 7, 2014
Sold by
Community Bank Of Raymore
Bought by
Plunkett Brandon S and Plunkett Heather I
Home Financials for this Owner
Home Financials are based on the most recent Mortgage that was taken out on this home.
Original Mortgage
$380,000
Interest Rate
4.44%
Mortgage Type
Future Advance Clause Open End Mortgage
Purchase Details
Closed on
Jul 8, 2013
Sold by
Lee Greg A and Leeby Karen Sue
Bought by
Commerce Bank
Create a Home Valuation Report for This Property
The Home Valuation Report is an in-depth analysis detailing your home's value as well as a comparison with similar homes in the area
Home Values in the Area
Average Home Value in this Area
Purchase History
| Date | Buyer | Sale Price | Title Company |
|---|---|---|---|
| Christensen Jan J | -- | Coffelt Land Title Inc | |
| Community Bank Of Raymore | $15,000 | None Available | |
| Plunkett Brandon S | -- | Coffelt Land Title Inc | |
| Plunkett Brandon S | -- | Coffelt Land Title Inc | |
| Commerce Bank | $56,020 | None Available |
Source: Public Records
Mortgage History
| Date | Status | Borrower | Loan Amount |
|---|---|---|---|
| Previous Owner | Plunkett Brandon S | $15,900 | |
| Previous Owner | Plunkett Brandon S | $380,000 |
Source: Public Records
Tax History Compared to Growth
Tax History
| Year | Tax Paid | Tax Assessment Tax Assessment Total Assessment is a certain percentage of the fair market value that is determined by local assessors to be the total taxable value of land and additions on the property. | Land | Improvement |
|---|---|---|---|---|
| 2024 | $18,817 | $258,100 | $29,970 | $228,130 |
| 2023 | $18,718 | $258,100 | $29,970 | $228,130 |
| 2022 | $19,159 | $261,420 | $29,970 | $231,450 |
| 2021 | $10,725 | $146,330 | $29,970 | $116,360 |
| 2020 | $11,118 | $152,080 | $23,970 | $128,110 |
| 2019 | $10,355 | $152,080 | $23,970 | $128,110 |
| 2018 | $10,434 | $152,080 | $23,970 | $128,110 |
| 2017 | $9,077 | $152,080 | $23,970 | $128,110 |
| 2016 | $9,077 | $131,430 | $23,970 | $107,460 |
| 2015 | $7,660 | $110,910 | $23,970 | $86,940 |
| 2014 | $7,662 | $110,910 | $23,970 | $86,940 |
| 2013 | -- | $110,910 | $23,970 | $86,940 |
Source: Public Records
Map
Nearby Homes
- 0 Hickory St
- 706 S Butler Dr
- 802 S Butler Dr
- 104 W Pearl St
- 402 N Independence St
- 603 S Independence St
- 1100 S Independence St
- 0 Missouri 2
- 1005 S Independence St
- 203 Bowman St
- 1303 S Independence St
- 505 E Wall St
- 701 & 703 Cass St
- 307 N Bradley Ave
- 616 Ann Ave
- 805 Ash St
- 0 Brookhart Dr
- 100 W Walker Dr
- 0 E Pine St
- 900 N King Ave
- 1700 W Mechanic St
- 1906 W Mechanic St
- 1904 W Mechanic St
- 502 Westchester Ave
- 1600 W Mechanic St
- 1504 W Wall St
- 205 N Clearwater Dr
- 310 N Clearwater Dr
- 306 N Clearwater Dr
- 0 Clearwater Dr Unit 2357522
- 0 Clearwater Dr
- 700 Plaza Dr
- 801 Westchester Ave
- 205 N Commercial St
- 203 N Commercial St
- 1501 W Vine St
- 701 W Mechanic St
- 201 N Commercial St
- 1009 W Wall St
- 706 S Commercial St