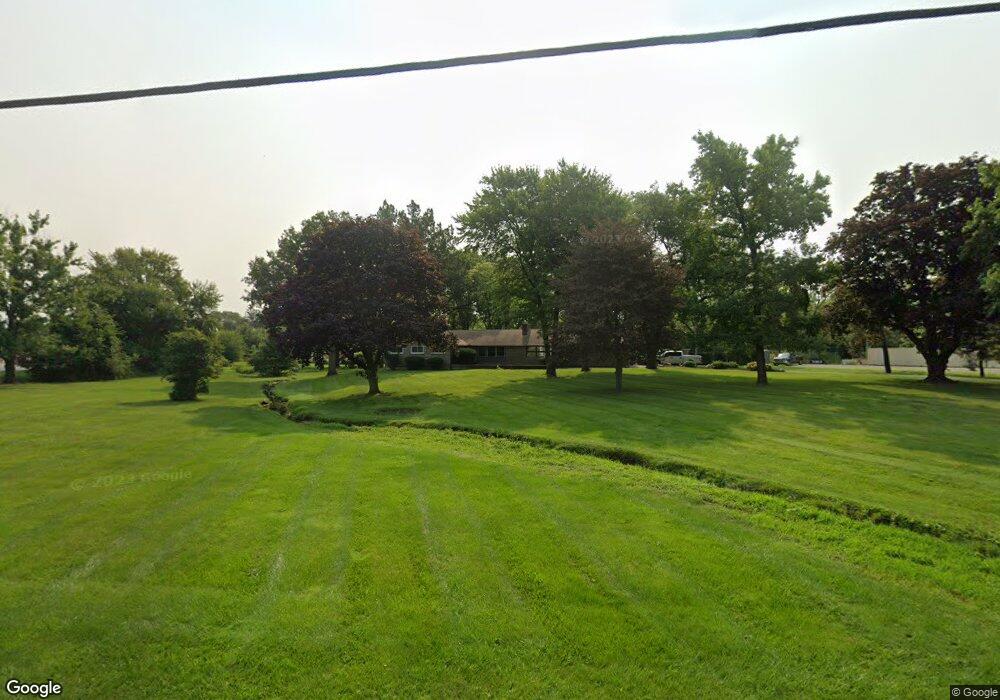
1700 Walcutt Rd Columbus, OH 43228
Estimated Value: $529,000 - $879,675
3
Beds
3
Baths
2,184
Sq Ft
$344/Sq Ft
Est. Value
About This Home
This home is located at 1700 Walcutt Rd, Columbus, OH 43228 and is currently estimated at $751,225, approximately $343 per square foot. 1700 Walcutt Rd is a home located in Franklin County with nearby schools including Hilliard Horizon Elementary School, Hilliard Station Sixth Grade Elementary School, and Hilliard Heritage Middle School.
Ownership History
Date
Name
Owned For
Owner Type
Purchase Details
Closed on
May 23, 2007
Sold by
Livengood Runyon William S and Livengood Runyon Lisa D
Bought by
R & M Property Management Llc
Current Estimated Value
Purchase Details
Closed on
Mar 1, 2006
Sold by
Schenz Stephen A and June E Schenz Trust
Bought by
Livengood Runyon William S and Livengood Runyon Lisa D
Home Financials for this Owner
Home Financials are based on the most recent Mortgage that was taken out on this home.
Original Mortgage
$352,000
Interest Rate
6.2%
Mortgage Type
Purchase Money Mortgage
Purchase Details
Closed on
Sep 1, 2004
Sold by
Schenz Stephen Alan and June E Schenz Trust
Bought by
City Of Columbus Ohio
Purchase Details
Closed on
Feb 8, 2000
Sold by
Schenz June E
Bought by
Schenz June E and Schenz Stephen Alan
Purchase Details
Closed on
Feb 17, 1999
Sold by
Estate Of John W Schenz
Bought by
Schenz June E
Create a Home Valuation Report for This Property
The Home Valuation Report is an in-depth analysis detailing your home's value as well as a comparison with similar homes in the area
Home Values in the Area
Average Home Value in this Area
Purchase History
| Date | Buyer | Sale Price | Title Company |
|---|---|---|---|
| R & M Property Management Llc | -- | Attorney | |
| Livengood Runyon William S | $390,000 | Valley Titl | |
| City Of Columbus Ohio | -- | -- | |
| Schenz June E | -- | -- | |
| Schenz June E | -- | -- |
Source: Public Records
Mortgage History
| Date | Status | Borrower | Loan Amount |
|---|---|---|---|
| Previous Owner | Livengood Runyon William S | $352,000 |
Source: Public Records
Tax History Compared to Growth
Tax History
| Year | Tax Paid | Tax Assessment Tax Assessment Total Assessment is a certain percentage of the fair market value that is determined by local assessors to be the total taxable value of land and additions on the property. | Land | Improvement |
|---|---|---|---|---|
| 2024 | $12,913 | $220,960 | $150,080 | $70,880 |
| 2023 | $11,248 | $220,955 | $150,080 | $70,875 |
| 2022 | $12,765 | $200,030 | $129,470 | $70,560 |
| 2021 | $12,565 | $200,030 | $129,470 | $70,560 |
| 2020 | $12,214 | $194,470 | $129,470 | $65,000 |
| 2019 | $12,407 | $169,090 | $112,560 | $56,530 |
| 2018 | $6,268 | $169,090 | $112,560 | $56,530 |
| 2017 | $12,320 | $169,090 | $112,560 | $56,530 |
| 2016 | $13,405 | $169,750 | $112,560 | $57,190 |
| 2015 | $6,296 | $169,750 | $112,560 | $57,190 |
| 2014 | $12,566 | $169,750 | $112,560 | $57,190 |
| 2013 | $6,377 | $169,750 | $112,560 | $57,190 |
Source: Public Records
Map
Nearby Homes
- 1331 Kellerman Ct
- 4719 Trabue Woods Ct
- 4451 Sherwill Rd
- 1395 Dillingham Ct
- 4457 Nickerson Rd
- 4969 Hilliard Green Dr
- 4381 Alderson Ct
- 2321 Shelby Ln
- 2378 Myrtle Valley Dr
- 5500 Valencia Park Blvd Unit 1E
- 2401 Featherwood Dr
- 4955 Baycroft Dr
- 1652 Bennigan Dr Unit 175A
- 5589 Valencia Park Blvd Unit 11A
- 5503 Nike Dr
- 5703 Palos Ln Unit 167E
- 1856 Hobbes Dr Unit 73C
- 0 Hillard Road St Unit 225040295
- 5706 Rutgers Ln Unit 180A
- 2002 Jasper Ln Unit 26D
- 1764 Walcutt Rd
- 5030 Transamerica Dr
- 0 Transamerica Dr
- 5033 Transamerica Dr
- 4991 Transamerica Dr
- 5140 Trabue Rd
- 5110 Trabue Rd
- 5100 Trabue Rd
- 5019 Transamerica Dr
- 1545 Walcutt Rd
- 5141 Trabue Rd
- 1701 Walcutt Rd
- 1541 Walcutt Rd
- 1730 Atlas St
- 5230 Renner Rd
- 1819 Walcutt Rd
- 0 Atlas St
- 1695 Atlas St
- 5211 Trabue Rd Unit B
- 1755 Atlas St