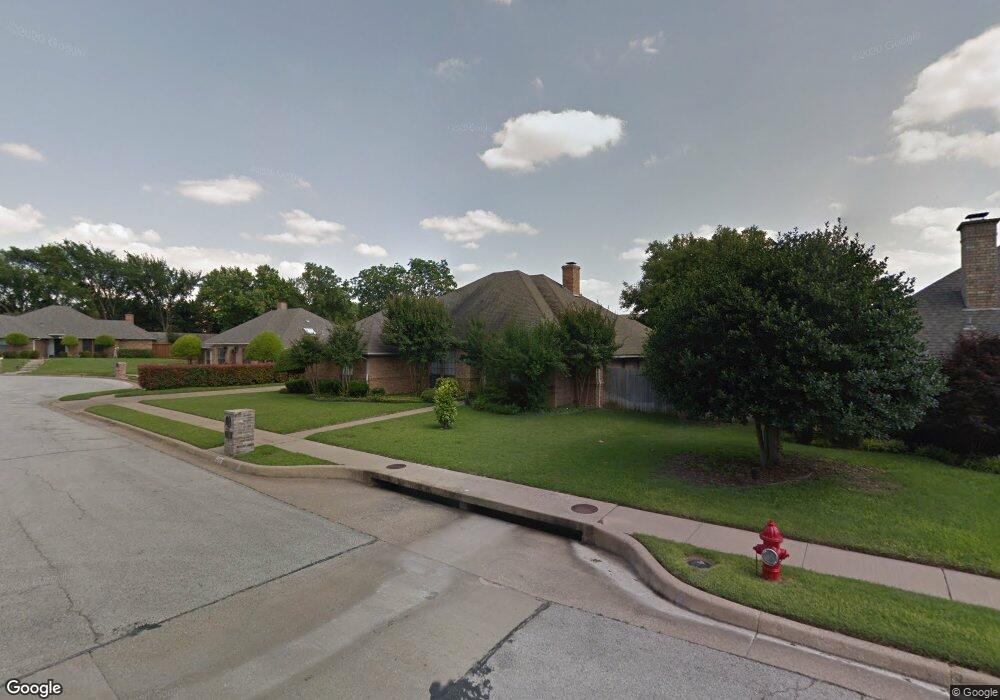
1700 Warwickshire Ct E Bedford, TX 76021
Estimated Value: $475,000 - $506,000
4
Beds
3
Baths
2,494
Sq Ft
$195/Sq Ft
Est. Value
About This Home
This home is located at 1700 Warwickshire Ct E, Bedford, TX 76021 and is currently estimated at $485,182, approximately $194 per square foot. 1700 Warwickshire Ct E is a home located in Tarrant County with nearby schools including Shady Brook Elementary School, Harwood Junior High School, and Trinity High School.
Ownership History
Date
Name
Owned For
Owner Type
Purchase Details
Closed on
Nov 1, 2005
Sold by
Duty Debra J
Bought by
Davis Harold D and Davis Wilma J
Current Estimated Value
Home Financials for this Owner
Home Financials are based on the most recent Mortgage that was taken out on this home.
Original Mortgage
$142,600
Outstanding Balance
$76,742
Interest Rate
5.75%
Mortgage Type
Fannie Mae Freddie Mac
Estimated Equity
$408,440
Purchase Details
Closed on
Aug 24, 1998
Sold by
Estes Boyce L
Bought by
Duty Debra J
Home Financials for this Owner
Home Financials are based on the most recent Mortgage that was taken out on this home.
Original Mortgage
$133,450
Interest Rate
10.5%
Purchase Details
Closed on
May 5, 1995
Sold by
Wilson Toni Lynn Daste
Bought by
Estes Boyce L and Estes Marcia Bender
Create a Home Valuation Report for This Property
The Home Valuation Report is an in-depth analysis detailing your home's value as well as a comparison with similar homes in the area
Home Values in the Area
Average Home Value in this Area
Purchase History
| Date | Buyer | Sale Price | Title Company |
|---|---|---|---|
| Davis Harold D | -- | -- | |
| Duty Debra J | -- | Rattikin Title Co | |
| Estes Boyce L | -- | American Title Company |
Source: Public Records
Mortgage History
| Date | Status | Borrower | Loan Amount |
|---|---|---|---|
| Open | Davis Harold D | $142,600 | |
| Previous Owner | Duty Debra J | $133,450 |
Source: Public Records
Tax History Compared to Growth
Tax History
| Year | Tax Paid | Tax Assessment Tax Assessment Total Assessment is a certain percentage of the fair market value that is determined by local assessors to be the total taxable value of land and additions on the property. | Land | Improvement |
|---|---|---|---|---|
| 2025 | $3,320 | $365,000 | $75,000 | $290,000 |
| 2024 | $3,320 | $387,162 | $75,000 | $312,162 |
| 2023 | $7,260 | $394,201 | $75,000 | $319,201 |
| 2022 | $5,081 | $359,049 | $75,000 | $284,049 |
| 2021 | $7,369 | $312,837 | $75,000 | $237,837 |
| 2020 | $7,438 | $312,837 | $75,000 | $237,837 |
| 2019 | $7,600 | $312,837 | $75,000 | $237,837 |
| 2018 | $4,975 | $297,160 | $75,000 | $222,160 |
| 2017 | $6,535 | $272,571 | $30,000 | $242,571 |
| 2016 | $5,941 | $245,586 | $30,000 | $215,586 |
| 2015 | $5,005 | $247,100 | $30,000 | $217,100 |
| 2014 | $5,005 | $247,100 | $30,000 | $217,100 |
Source: Public Records
Map
Nearby Homes
- 1601 Warwickshire Ct W
- 2524 Shady Ridge Dr
- 2503 Shady Ridge Dr
- 31 Morrow Dr
- 37 Devonshire Dr
- 49 Morrow Dr
- 1630 Post Oak Dr
- 2112 Oakmeadow Place
- 22 Lincolnshire Cir
- 2901 Miles Way
- 1723 Post Oak Dr
- 2024 Oakmeadow St
- 2109 Oakmeadow St
- 6 Park Ln
- 18 Park Ln
- 2508 Lakeview Dr
- 1401 Danielle Dr
- 2317 Shady Grove Dr
- 1704 Indian Oaks Ct
- 2501 Shady Grove Dr
- 1612 Warwickshire Ct W
- 1704 Warwickshire Ct E
- 2500 Wiltshire St
- 1608 Warwickshire Ct W
- 1708 Warwickshire Ct E
- 2501 Wiltshire St
- 1705 Warwickshire Ct E
- 2504 Wiltshire St
- 2505 Wiltshire St
- 1604 Warwickshire Ct W
- 1605 Warwickshire Ct W
- 1616 Bedfordshire
- 1704 Berwichshire Ct
- 1612 Bedfordshire
- 1708 Berwichshire Ct
- 1600 Warwickshire Ct W
- 1608 Bedfordshire
- 1700 Berwichshire Ct
- 1712 Berwichshire Ct
- 1604 Bedfordshire