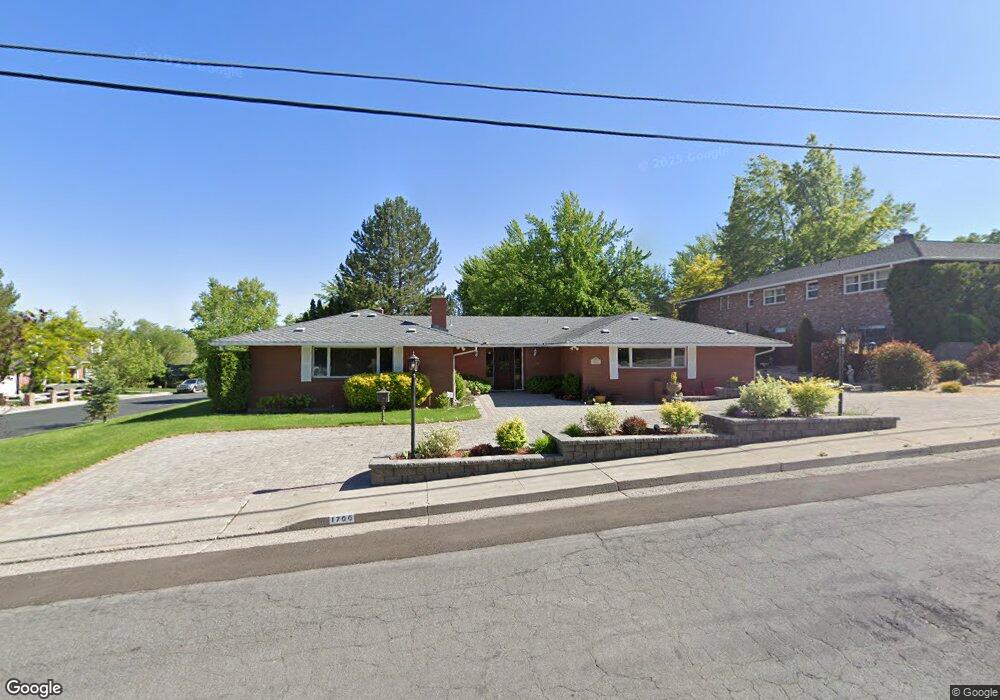
1700 Webster Way Reno, NV 89509
Skyline Boulevard NeighborhoodEstimated Value: $915,000 - $1,200,000
4
Beds
2
Baths
3,360
Sq Ft
$316/Sq Ft
Est. Value
About This Home
This home is located at 1700 Webster Way, Reno, NV 89509 and is currently estimated at $1,062,088, approximately $316 per square foot. 1700 Webster Way is a home located in Washoe County with nearby schools including Jessie Beck Elementary School, Darrell C Swope Middle School, and Reno High School.
Ownership History
Date
Name
Owned For
Owner Type
Purchase Details
Closed on
Oct 31, 2016
Sold by
Mishler William G
Bought by
Foster Brad L and Foster Sandra K
Current Estimated Value
Home Financials for this Owner
Home Financials are based on the most recent Mortgage that was taken out on this home.
Original Mortgage
$380,000
Outstanding Balance
$305,650
Interest Rate
3.48%
Mortgage Type
New Conventional
Estimated Equity
$756,438
Purchase Details
Closed on
Oct 27, 2016
Sold by
Vallerie Judith L
Bought by
Misher William G
Home Financials for this Owner
Home Financials are based on the most recent Mortgage that was taken out on this home.
Original Mortgage
$380,000
Outstanding Balance
$305,650
Interest Rate
3.48%
Mortgage Type
New Conventional
Estimated Equity
$756,438
Purchase Details
Closed on
Apr 22, 1998
Sold by
Mishler Maureen
Bought by
Mishler William G
Home Financials for this Owner
Home Financials are based on the most recent Mortgage that was taken out on this home.
Original Mortgage
$202,500
Interest Rate
7.15%
Create a Home Valuation Report for This Property
The Home Valuation Report is an in-depth analysis detailing your home's value as well as a comparison with similar homes in the area
Home Values in the Area
Average Home Value in this Area
Purchase History
| Date | Buyer | Sale Price | Title Company |
|---|---|---|---|
| Foster Brad L | $475,000 | First Centennial Reno | |
| Misher William G | -- | First Centennial Reno | |
| Mishler William G | -- | Founders Title Co |
Source: Public Records
Mortgage History
| Date | Status | Borrower | Loan Amount |
|---|---|---|---|
| Open | Foster Brad L | $380,000 | |
| Previous Owner | Mishler William G | $202,500 |
Source: Public Records
Tax History Compared to Growth
Tax History
| Year | Tax Paid | Tax Assessment Tax Assessment Total Assessment is a certain percentage of the fair market value that is determined by local assessors to be the total taxable value of land and additions on the property. | Land | Improvement |
|---|---|---|---|---|
| 2025 | $3,502 | $144,106 | $79,310 | $64,796 |
| 2024 | $3,402 | $140,647 | $77,000 | $63,647 |
| 2023 | $3,402 | $134,121 | $75,250 | $58,871 |
| 2022 | $3,302 | $111,057 | $63,000 | $48,057 |
| 2021 | $3,207 | $103,519 | $56,700 | $46,819 |
| 2020 | $3,112 | $102,623 | $56,700 | $45,923 |
| 2019 | $3,021 | $96,436 | $52,500 | $43,936 |
| 2018 | $2,934 | $90,986 | $49,000 | $41,986 |
| 2017 | $2,852 | $89,760 | $47,250 | $42,510 |
| 2016 | $2,782 | $97,470 | $52,500 | $44,970 |
| 2015 | $2,775 | $85,064 | $38,500 | $46,564 |
| 2014 | $2,695 | $79,311 | $32,830 | $46,481 |
| 2013 | -- | $71,184 | $24,325 | $46,859 |
Source: Public Records
Map
Nearby Homes
- 2350 Barnes Cir
- 2080 Del Rio Ln
- 2315 Armstrong Ln
- 2345 Crescent Cir
- 1400 Belford Rd
- 2905 Susileen Dr
- 2699 Rodney Dr
- 2693 Rodney Dr Unit 18-331-04
- 1950 W Plumb Ln
- 2915 Susileen Dr
- 1890 Palisade Dr
- 2345 Camelot Way
- 0 Plumb Ln
- 1425 Julie Ct
- 1725 Aquila Ave
- 1740 McNevin Ct
- 2240 W Plumb Ln
- 995 Skyline Blvd
- 2195 W Plumb Ln
- 1478 Clough Rd
- 2305 Pleasure Dr
- 1790 Webster Way
- 1690 Webster Way
- 2320 Fireside Cir
- 2304 Pleasure Dr
- 1645 Webster Way
- 1635 Webster Way
- 2310 Pleasure Dr
- 1855 Webster Way
- 2350 Fireside Cir
- 2301 Barnes Cir
- 2201 Barnes Blvd
- 2385 Barnes Cir
- 2301 Fireside Cir
- 2155 Barnes Blvd
- 2360 Fireside Cir
- 1865 Webster Way
- 2330 Pleasure Dr
- 2290 Barnes Blvd
- 1880 Berkeley Dr