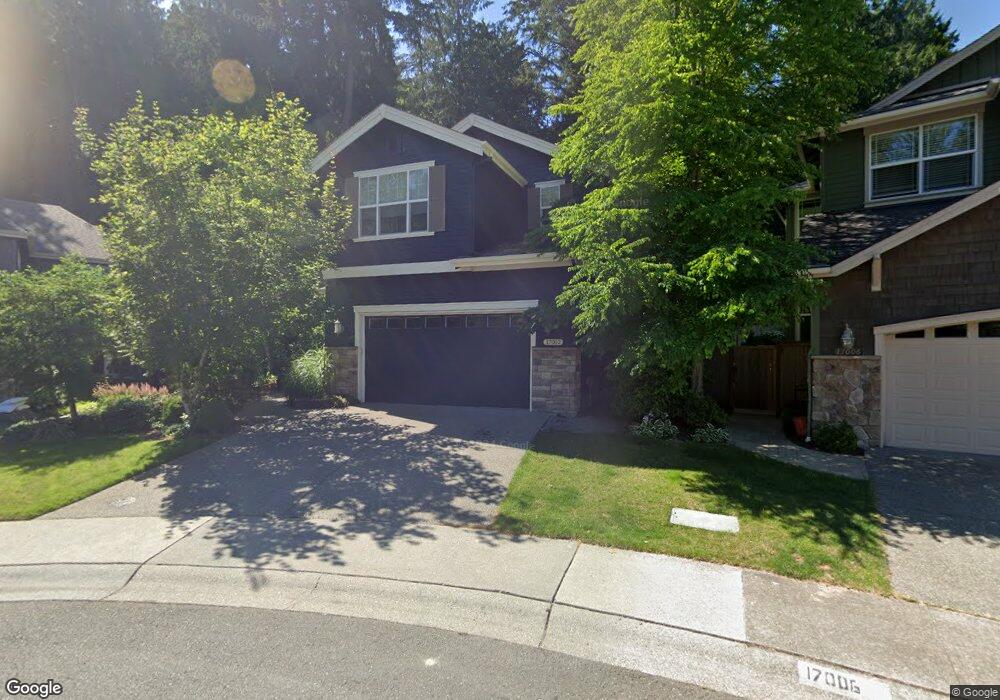
17002 NE 112th Way Redmond, WA 98052
North Redmond NeighborhoodEstimated Value: $1,807,000 - $2,041,000
4
Beds
3
Baths
2,830
Sq Ft
$693/Sq Ft
Est. Value
About This Home
This home is located at 17002 NE 112th Way, Redmond, WA 98052 and is currently estimated at $1,960,617, approximately $692 per square foot. 17002 NE 112th Way is a home located in King County with nearby schools including Albert Einstein Elementary School, Redmond Middle School, and Redmond High School.
Ownership History
Date
Name
Owned For
Owner Type
Purchase Details
Closed on
Jan 26, 2010
Sold by
Carney Scott A
Bought by
Bibeault Renee M
Current Estimated Value
Purchase Details
Closed on
Apr 2, 2007
Sold by
Pokorny Loren S and Pokorny Greta E
Bought by
Carney Scott A and Bibeault Renee M
Home Financials for this Owner
Home Financials are based on the most recent Mortgage that was taken out on this home.
Original Mortgage
$111,000
Interest Rate
6.1%
Mortgage Type
Credit Line Revolving
Purchase Details
Closed on
Jan 12, 2005
Sold by
Rick Burnstead Construction Co
Bought by
Pokorny Loren S and Pokorny Greta E
Home Financials for this Owner
Home Financials are based on the most recent Mortgage that was taken out on this home.
Original Mortgage
$476,000
Interest Rate
4.07%
Mortgage Type
Purchase Money Mortgage
Create a Home Valuation Report for This Property
The Home Valuation Report is an in-depth analysis detailing your home's value as well as a comparison with similar homes in the area
Home Values in the Area
Average Home Value in this Area
Purchase History
| Date | Buyer | Sale Price | Title Company |
|---|---|---|---|
| Bibeault Renee M | -- | None Available | |
| Carney Scott A | $740,000 | Transnation Ti | |
| Pokorny Loren S | $595,000 | Chicago Title Insurance Co |
Source: Public Records
Mortgage History
| Date | Status | Borrower | Loan Amount |
|---|---|---|---|
| Previous Owner | Carney Scott A | $111,000 | |
| Previous Owner | Carney Scott A | $592,000 | |
| Previous Owner | Pokorny Loren S | $476,000 | |
| Closed | Pokorny Loren S | $59,500 |
Source: Public Records
Tax History Compared to Growth
Tax History
| Year | Tax Paid | Tax Assessment Tax Assessment Total Assessment is a certain percentage of the fair market value that is determined by local assessors to be the total taxable value of land and additions on the property. | Land | Improvement |
|---|---|---|---|---|
| 2024 | $12,674 | $1,613,000 | $652,000 | $961,000 |
| 2023 | $12,430 | $1,357,000 | $554,000 | $803,000 |
| 2022 | $10,182 | $1,691,000 | $694,000 | $997,000 |
| 2021 | $9,380 | $1,184,000 | $486,000 | $698,000 |
| 2020 | $9,254 | $1,008,000 | $415,000 | $593,000 |
| 2018 | $8,221 | $905,000 | $327,000 | $578,000 |
| 2017 | $7,188 | $823,000 | $302,000 | $521,000 |
| 2016 | $6,985 | $751,000 | $272,000 | $479,000 |
| 2015 | $6,757 | $723,000 | $263,000 | $460,000 |
| 2014 | -- | $675,000 | $245,000 | $430,000 |
| 2013 | -- | $560,000 | $219,000 | $341,000 |
Source: Public Records
Map
Nearby Homes
- 17228 NE 113th Ct
- 11217 167th Ct NE
- 10925 165th Place NE
- 16825 NE 106th St
- 17128 NE 120th St
- 12050 167th Place NE
- 11316 178th Place NE
- 11418 179th Ct NE
- 11526 160th Ct NE
- 10417 165th Place NE
- 12265 168th Ct NE
- 0 113th St E Unit SR25128907
- 16704 NE 102nd Place
- 16810 NE 123rd Way
- 16709 NE 102nd Place
- 1203 X Dave Rd
- 15824 NE 111th St
- 16707 NE 124th St
- 15651 NE 116th St
- 12011 184th Ave NE
- 17001 NE 112th Way
- 17006 NE 112th Way
- 17005 NE 112th Way
- 17010 NE 112th Way
- 17021 NE 113th Ct
- 17009 NE 112th Way
- 17017 NE 113th Ct
- 17011 NE 112th Way
- 17025 NE 113th Ct
- 17014 NE 112th Way
- 11320 169th Ct NE
- 17015 NE 112th Way
- 17029 NE 113th Ct
- 17018 NE 113th Ct
- 17101 NE 112th Way
- 17022 NE 113th Ct
- 11222 171st Place NE
- 11228 171st Place NE
- 17034 NE 113th Ct
- 17026 NE 113th Ct