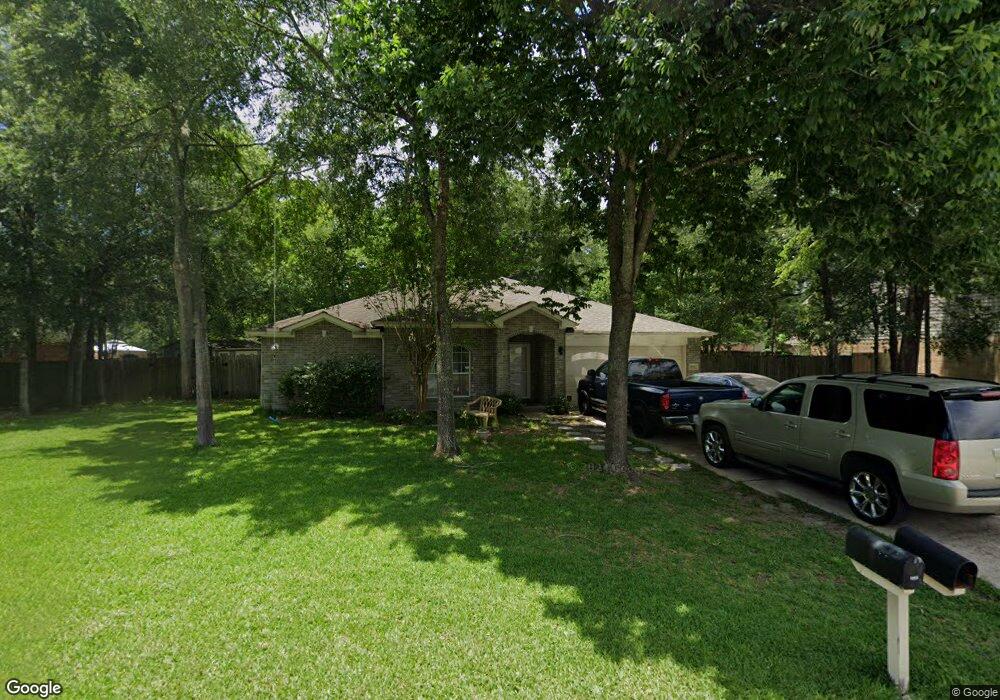
17007 Scuttle Way Crosby, TX 77532
Estimated Value: $236,000 - $265,000
3
Beds
2
Baths
1,540
Sq Ft
$161/Sq Ft
Est. Value
About This Home
This home is located at 17007 Scuttle Way, Crosby, TX 77532 and is currently estimated at $248,539, approximately $161 per square foot. 17007 Scuttle Way is a home located in Harris County with nearby schools including Newport Elementary School, Crosby Middle School, and Crosby High School.
Ownership History
Date
Name
Owned For
Owner Type
Purchase Details
Closed on
Oct 2, 2020
Sold by
Helm Amy Dawn
Bought by
Amaya Jorge A
Current Estimated Value
Home Financials for this Owner
Home Financials are based on the most recent Mortgage that was taken out on this home.
Original Mortgage
$192,449
Outstanding Balance
$171,173
Interest Rate
2.9%
Mortgage Type
FHA
Estimated Equity
$77,366
Purchase Details
Closed on
Apr 11, 2003
Sold by
Jrk Holdings Inc
Bought by
Polk Jonathan D
Home Financials for this Owner
Home Financials are based on the most recent Mortgage that was taken out on this home.
Original Mortgage
$98,800
Interest Rate
5.71%
Purchase Details
Closed on
Jan 2, 1994
Sold by
Saka Rhoda Danziger
Bought by
Newport Partners
Create a Home Valuation Report for This Property
The Home Valuation Report is an in-depth analysis detailing your home's value as well as a comparison with similar homes in the area
Home Values in the Area
Average Home Value in this Area
Purchase History
| Date | Buyer | Sale Price | Title Company |
|---|---|---|---|
| Amaya Jorge A | -- | Monarch Title | |
| Amaya Jorge A | -- | Monarch Title Of Texas | |
| Polk Jonathan D | -- | Stewart Title Company | |
| Newport Partners | -- | -- |
Source: Public Records
Mortgage History
| Date | Status | Borrower | Loan Amount |
|---|---|---|---|
| Open | Amaya Jorge A | $192,449 | |
| Closed | Amaya Jorge A | $192,449 | |
| Previous Owner | Polk Jonathan D | $98,800 |
Source: Public Records
Tax History Compared to Growth
Tax History
| Year | Tax Paid | Tax Assessment Tax Assessment Total Assessment is a certain percentage of the fair market value that is determined by local assessors to be the total taxable value of land and additions on the property. | Land | Improvement |
|---|---|---|---|---|
| 2025 | $2,546 | $216,242 | $52,164 | $164,078 |
| 2024 | $2,546 | $211,709 | $46,575 | $165,134 |
| 2023 | $2,546 | $225,372 | $46,575 | $178,797 |
| 2022 | $4,672 | $204,521 | $40,986 | $163,535 |
| 2021 | $4,384 | $161,747 | $33,534 | $128,213 |
| 2020 | $4,427 | $156,971 | $29,808 | $127,163 |
| 2019 | $4,669 | $160,988 | $22,356 | $138,632 |
| 2018 | $1,967 | $144,206 | $22,356 | $121,850 |
| 2017 | $4,097 | $136,377 | $13,041 | $123,336 |
| 2016 | $4,007 | $133,383 | $13,041 | $120,342 |
| 2015 | $3,083 | $121,711 | $13,041 | $108,670 |
| 2014 | $3,083 | $115,838 | $13,041 | $102,797 |
Source: Public Records
Map
Nearby Homes
- 17103 Scuttle Way
- 17102 Jetty Ct
- 342 Harbor Mist Dr
- 403 Dorsal Way
- 17030 Port o Call St
- 17107 Coaming Ct
- 454 Fishhawk Way
- 17147 Morning Star Ave
- TBD Pelican Dr
- 438 Dorsal Way
- 439 Fishhawk Way
- 16823 S Lighthouse Dr
- 302 Pelican Dr
- 16919 Lacing Ct
- 726 Flying Bridge Way
- 16806 S Lighthouse Dr
- 16727 Camber Ct
- 0 Marlin Spike Way
- 17502 S Compass Rose Cir
- 516 Aweigh Dr
- 17007 Scuttle Way
- 17015 Scuttle Way
- 17003 Scuttle Way
- 17026 Pelorus Way
- 17019 Scuttle Way
- 17022 Pelorus Way
- 17034 Pelorus Way
- 502 Sea Anchor Way
- 17010 Scuttle Way
- 17023 Scuttle Way
- 17014 Scuttle Way
- 17018 Pelorus Way
- 17018 Scuttle Way
- 17038 Pelorus Way
- 510 Sea Anchor Way
- 17022 Scuttle Way
- 17014 Pelorus Way
- 514 Sea Anchor Way
- 17026 Scuttle Way
- 16910 Lanyard Way