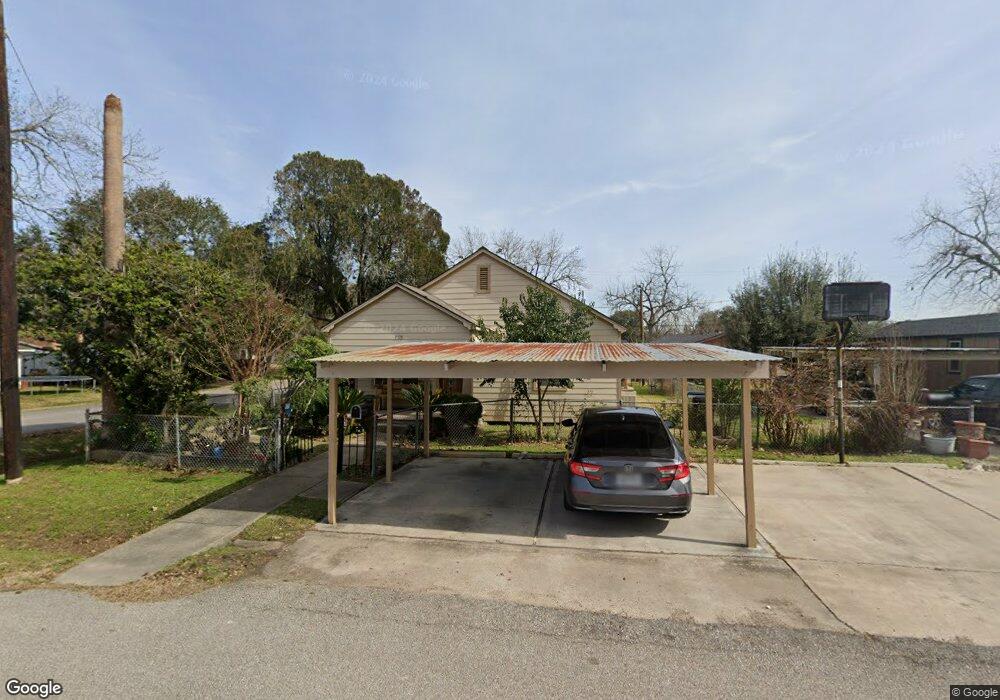
1701 7th St Rosenberg, TX 77471
Estimated Value: $196,000 - $226,000
2
Beds
1
Bath
1,224
Sq Ft
$171/Sq Ft
Est. Value
About This Home
This home is located at 1701 7th St, Rosenberg, TX 77471 and is currently estimated at $209,009, approximately $170 per square foot. 1701 7th St is a home located in Fort Bend County with nearby schools including Taylor Ray Elementary School, Navarro Middle School, and George Junior High School.
Ownership History
Date
Name
Owned For
Owner Type
Purchase Details
Closed on
Mar 1, 2014
Sold by
Galdamez Jose Roberto
Bought by
Galdamez Sandra Luz
Current Estimated Value
Purchase Details
Closed on
May 3, 1996
Sold by
Kocurek Alice Marie and Richter Alice Marie
Bought by
Galdamez Jose and Galdamez Sandra
Home Financials for this Owner
Home Financials are based on the most recent Mortgage that was taken out on this home.
Original Mortgage
$24,750
Outstanding Balance
$1,368
Interest Rate
7.67%
Mortgage Type
Seller Take Back
Estimated Equity
$207,641
Create a Home Valuation Report for This Property
The Home Valuation Report is an in-depth analysis detailing your home's value as well as a comparison with similar homes in the area
Home Values in the Area
Average Home Value in this Area
Purchase History
| Date | Buyer | Sale Price | Title Company |
|---|---|---|---|
| Galdamez Sandra Luz | -- | None Available | |
| Galdamez Jose | -- | Fort Bend Title Company |
Source: Public Records
Mortgage History
| Date | Status | Borrower | Loan Amount |
|---|---|---|---|
| Open | Galdamez Jose | $24,750 |
Source: Public Records
Tax History Compared to Growth
Tax History
| Year | Tax Paid | Tax Assessment Tax Assessment Total Assessment is a certain percentage of the fair market value that is determined by local assessors to be the total taxable value of land and additions on the property. | Land | Improvement |
|---|---|---|---|---|
| 2025 | $1,219 | $149,552 | $59,707 | $127,945 |
| 2024 | $1,219 | $135,956 | -- | $155,285 |
| 2023 | $1,044 | $123,596 | $0 | $160,247 |
| 2022 | $1,623 | $112,360 | $0 | $126,040 |
| 2021 | $2,026 | $97,640 | $42,260 | $55,380 |
| 2020 | $1,616 | $76,120 | $41,670 | $34,450 |
| 2019 | $1,581 | $69,200 | $25,490 | $43,710 |
| 2018 | $1,460 | $62,910 | $25,490 | $37,420 |
| 2017 | $1,335 | $57,190 | $25,490 | $31,700 |
| 2016 | $1,213 | $51,990 | $25,490 | $26,500 |
| 2015 | $808 | $52,420 | $25,490 | $26,930 |
| 2014 | $947 | $51,840 | $25,490 | $26,350 |
Source: Public Records
Map
Nearby Homes