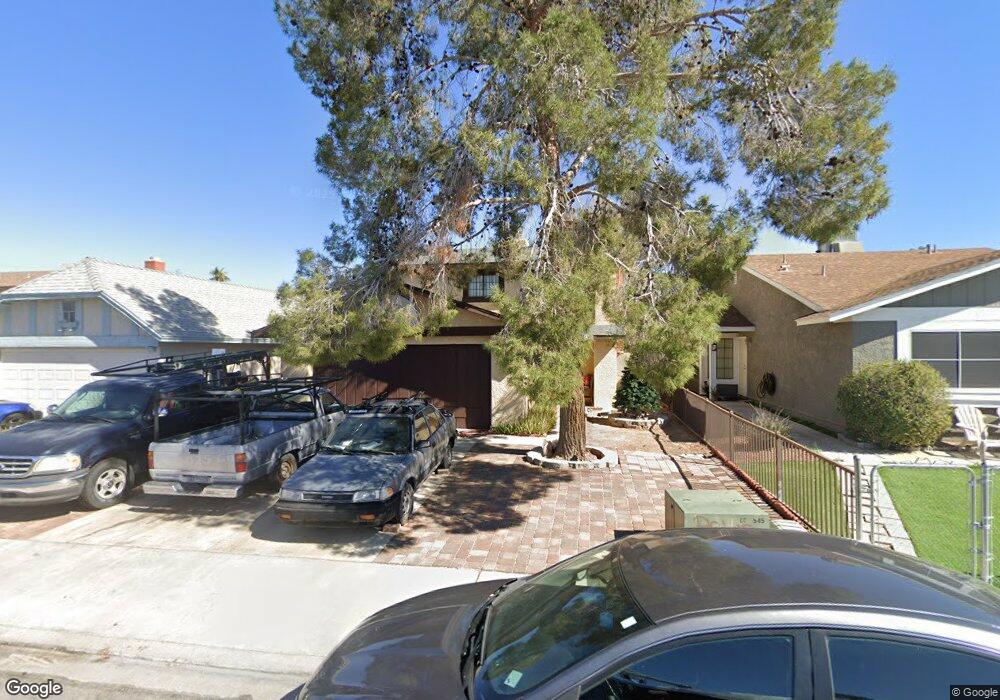
1701 Amboy Dr Las Vegas, NV 89108
Michael Way NeighborhoodEstimated Value: $334,371 - $369,000
3
Beds
3
Baths
1,260
Sq Ft
$278/Sq Ft
Est. Value
About This Home
This home is located at 1701 Amboy Dr, Las Vegas, NV 89108 and is currently estimated at $350,093, approximately $277 per square foot. 1701 Amboy Dr is a home located in Clark County with nearby schools including Lilly & Wing Fong Elementary School, J. Harold Brinley Middle School, and Western High School.
Ownership History
Date
Name
Owned For
Owner Type
Purchase Details
Closed on
Mar 14, 2007
Sold by
Delgado Maria De La Paz
Bought by
Roca Jose E
Current Estimated Value
Purchase Details
Closed on
Nov 12, 1999
Sold by
Escobedo Alfredo and Escobedo Leticia
Bought by
Delgado Maria Delapaz
Home Financials for this Owner
Home Financials are based on the most recent Mortgage that was taken out on this home.
Original Mortgage
$111,580
Interest Rate
7.72%
Mortgage Type
FHA
Purchase Details
Closed on
Mar 21, 1994
Sold by
Cisneros Henry G
Bought by
Escobedo Alfredo and Salazar Leticia
Home Financials for this Owner
Home Financials are based on the most recent Mortgage that was taken out on this home.
Original Mortgage
$86,288
Interest Rate
8.1%
Mortgage Type
FHA
Purchase Details
Closed on
Sep 21, 1993
Sold by
Alvillar Gene
Bought by
Countrywide Funding Corporation
Purchase Details
Closed on
Jul 7, 1992
Sold by
Countrywide Funding Corp
Bought by
Hud
Create a Home Valuation Report for This Property
The Home Valuation Report is an in-depth analysis detailing your home's value as well as a comparison with similar homes in the area
Home Values in the Area
Average Home Value in this Area
Purchase History
| Date | Buyer | Sale Price | Title Company |
|---|---|---|---|
| Roca Jose E | -- | Fidelity National Title Agen | |
| Delgado Maria Delapaz | $112,500 | Land Title | |
| Escobedo Alfredo | -- | Land Title | |
| Countrywide Funding Corporation | $66,818 | Nevada Title | |
| Hud | -- | Nevada Title Company |
Source: Public Records
Mortgage History
| Date | Status | Borrower | Loan Amount |
|---|---|---|---|
| Previous Owner | Delgado Maria Delapaz | $111,580 | |
| Previous Owner | Escobedo Alfredo | $86,288 |
Source: Public Records
Tax History Compared to Growth
Tax History
| Year | Tax Paid | Tax Assessment Tax Assessment Total Assessment is a certain percentage of the fair market value that is determined by local assessors to be the total taxable value of land and additions on the property. | Land | Improvement |
|---|---|---|---|---|
| 2025 | $1,030 | $51,367 | $24,150 | $27,217 |
| 2024 | $1,001 | $51,367 | $24,150 | $27,217 |
| 2023 | $1,001 | $53,216 | $26,600 | $26,616 |
| 2022 | $1,065 | $45,994 | $21,350 | $24,644 |
| 2021 | $986 | $43,769 | $19,950 | $23,819 |
| 2020 | $913 | $42,492 | $18,550 | $23,942 |
| 2019 | $856 | $38,994 | $15,050 | $23,944 |
| 2018 | $816 | $35,093 | $11,900 | $23,193 |
| 2017 | $1,134 | $34,579 | $10,850 | $23,729 |
| 2016 | $765 | $33,104 | $8,750 | $24,354 |
| 2015 | $1,010 | $28,798 | $5,950 | $22,848 |
| 2014 | $1,178 | $21,870 | $4,900 | $16,970 |
Source: Public Records
Map
Nearby Homes
- 1713 Amboy Dr
- 1704 Kismet Cir
- 1814 Marathon Dr
- 1630 Harvest Pecan Ct
- 1701 Goodrich Cir
- 1516 Bonnie Castle Way
- 6612 Lund Dr
- 6633 Gazelle Dr
- 6637 Lund Dr
- 1436 Padre Bay Dr
- 6520 Lombard Dr
- 1816 N Torrey Pines Dr
- 6400 Starcrest Dr
- 1624 N Torrey Pines Dr Unit 104
- 1608 N Torrey Pines Dr Unit 103
- 1624 N Torrey Pines Dr Unit 101
- 1600 N Torrey Pines Dr Unit 202
- 1600 N Torrey Pines Dr Unit 101
- 6380 Mint Frost Way
- 1617 Joshua Tree Ct
- 1705 Amboy Dr
- 1637 Amboy Dr
- 1633 Amboy Dr
- 1709 Amboy Dr
- 1654 Marathon Dr
- 1656 Marathon Dr
- 1658 Marathon Dr
- 1658 Marathon Dr Unit 28
- 1629 Amboy Dr
- 0 Crockett
- 1652 Marathon Dr
- 6600 Crockett Cir
- 1 Crockett
- 1650 Marathon Dr
- 1717 Amboy Dr Unit 1
- 1625 Amboy Dr Unit 1
- 1636 Marathon Dr
- 6601 Crockett Cir
- 1634 Marathon Dr
- 1648 Marathon Dr