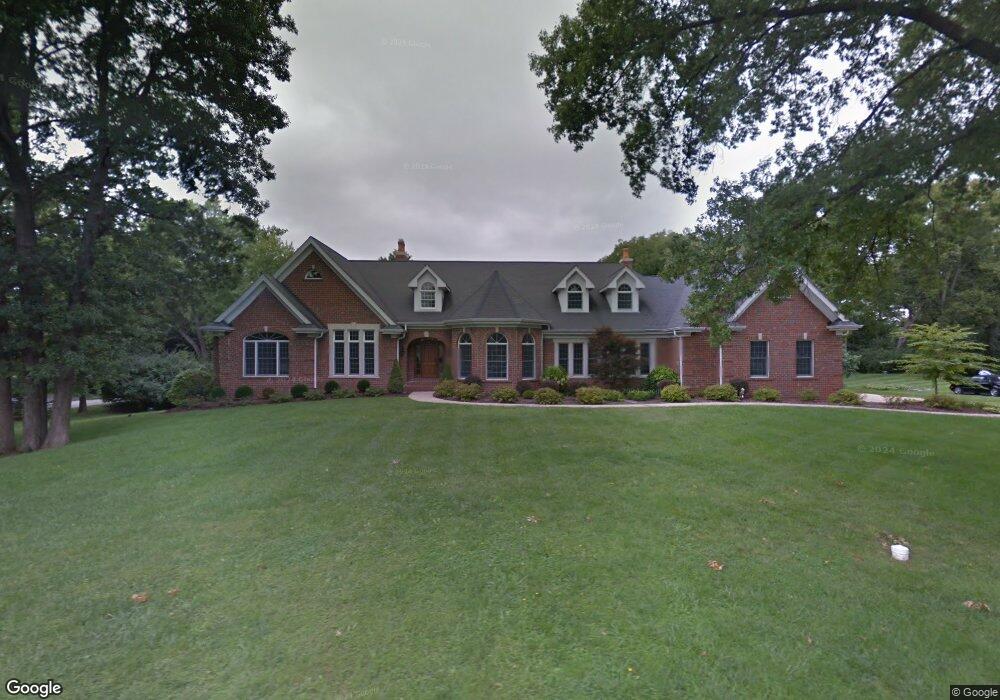
1701 Butternut Dr Saint Louis, MO 63131
Estimated Value: $1,436,000 - $2,380,000
3
Beds
4
Baths
8,002
Sq Ft
$238/Sq Ft
Est. Value
About This Home
This home is located at 1701 Butternut Dr, Saint Louis, MO 63131 and is currently estimated at $1,902,454, approximately $237 per square foot. 1701 Butternut Dr is a home located in St. Louis County with nearby schools including Westchester Elementary School, North Kirkwood Middle School, and Kirkwood Senior High School.
Ownership History
Date
Name
Owned For
Owner Type
Purchase Details
Closed on
Oct 31, 2024
Sold by
Lawrence J Hopp Trust and Hopp Lawrence J
Bought by
Hopp Lawrence J and Hopp Christine M
Current Estimated Value
Purchase Details
Closed on
May 10, 2023
Sold by
Hopp Christine T
Bought by
Hopp Lawrence J
Purchase Details
Closed on
Oct 4, 2018
Sold by
Hopp Christine T and Hopp Lawrence J
Bought by
Hopp Margaret C and Hopp Margaret C Trust
Home Financials for this Owner
Home Financials are based on the most recent Mortgage that was taken out on this home.
Interest Rate
4.71%
Purchase Details
Closed on
Jul 2, 2002
Sold by
Cummings Ray W
Bought by
Hopp Lawrence J and Hopp Christine T
Home Financials for this Owner
Home Financials are based on the most recent Mortgage that was taken out on this home.
Original Mortgage
$300,000
Interest Rate
5.5%
Purchase Details
Closed on
Aug 25, 1997
Sold by
Cummings Ray W
Bought by
Cummings Ray W and Trust Of Ray W Cummings
Create a Home Valuation Report for This Property
The Home Valuation Report is an in-depth analysis detailing your home's value as well as a comparison with similar homes in the area
Home Values in the Area
Average Home Value in this Area
Purchase History
| Date | Buyer | Sale Price | Title Company |
|---|---|---|---|
| Hopp Lawrence J | -- | None Listed On Document | |
| Hopp Lawrence J | -- | None Listed On Document | |
| Hopp Margaret C | -- | -- | |
| Hopp Lawrence J | $425,000 | -- | |
| Cummings Ray W | -- | -- |
Source: Public Records
Mortgage History
| Date | Status | Borrower | Loan Amount |
|---|---|---|---|
| Previous Owner | Hopp Margaret C | -- | |
| Previous Owner | Hopp Lawrence J | $300,000 |
Source: Public Records
Tax History Compared to Growth
Tax History
| Year | Tax Paid | Tax Assessment Tax Assessment Total Assessment is a certain percentage of the fair market value that is determined by local assessors to be the total taxable value of land and additions on the property. | Land | Improvement |
|---|---|---|---|---|
| 2025 | $19,962 | $315,610 | $128,250 | $187,360 |
| 2024 | $19,962 | $298,120 | $106,880 | $191,240 |
| 2023 | $19,962 | $298,120 | $106,880 | $191,240 |
| 2022 | $20,093 | $283,350 | $74,820 | $208,530 |
| 2021 | $19,908 | $283,350 | $74,820 | $208,530 |
| 2020 | $18,497 | $275,990 | $60,570 | $215,420 |
| 2019 | $18,519 | $275,990 | $60,570 | $215,420 |
| 2018 | $14,950 | $199,900 | $33,310 | $166,590 |
| 2017 | $14,984 | $199,900 | $33,310 | $166,590 |
| 2016 | $14,436 | $194,490 | $45,830 | $148,660 |
| 2015 | $14,452 | $194,490 | $45,830 | $148,660 |
| 2014 | $12,957 | $170,610 | $42,260 | $128,350 |
Source: Public Records
Map
Nearby Homes
- 723 Oak Valley Dr
- 1728 Folkstone Dr
- 1741 Pine Hill Dr
- 8 Briarbrook Trail
- 1345 Woodgate Dr
- 811 Cherry St
- 1126 Bopp Rd
- 22 Countryside Ln
- 11358 Manchester Rd
- 1090 Kinstern Dr
- 1120 Simmons Ave
- 1137 N Harrison Ave
- 1029 Kinstern Dr
- 1133 N Harrison Ave
- The Hawthorne Plan at Ballas Ridge
- The Roclare II Plan at Ballas Ridge
- The Westchester IV Plan at Ballas Ridge
- The Nottingham II Plan at Ballas Ridge
- The Hawthorne II Plan at Ballas Ridge
- TBB Ballas Ridge Hawthorne II
- 1717 Butternut Dr
- 1714 Butternut Dr
- 1700 Butternut Dr
- 700 Oak Valley Dr
- 668 Oak Valley Dr
- 1706 Pine Hill Dr
- 1729 Butternut Dr
- 1714 Pine Hill Dr
- 1726 Butternut Dr
- 722 Oak Valley Dr
- 727 Twin Fawns Dr
- 1722 Pine Hill Dr
- 721 Twin Fawns Dr
- 652 Oak Valley Dr
- 655 Oak Valley Dr
- 730 Oak Valley Dr
- 11701 Fawnridge Dr
- 750 Laurel Oak
- 701 Twin Fawns Dr
- 737 Oak Valley Dr