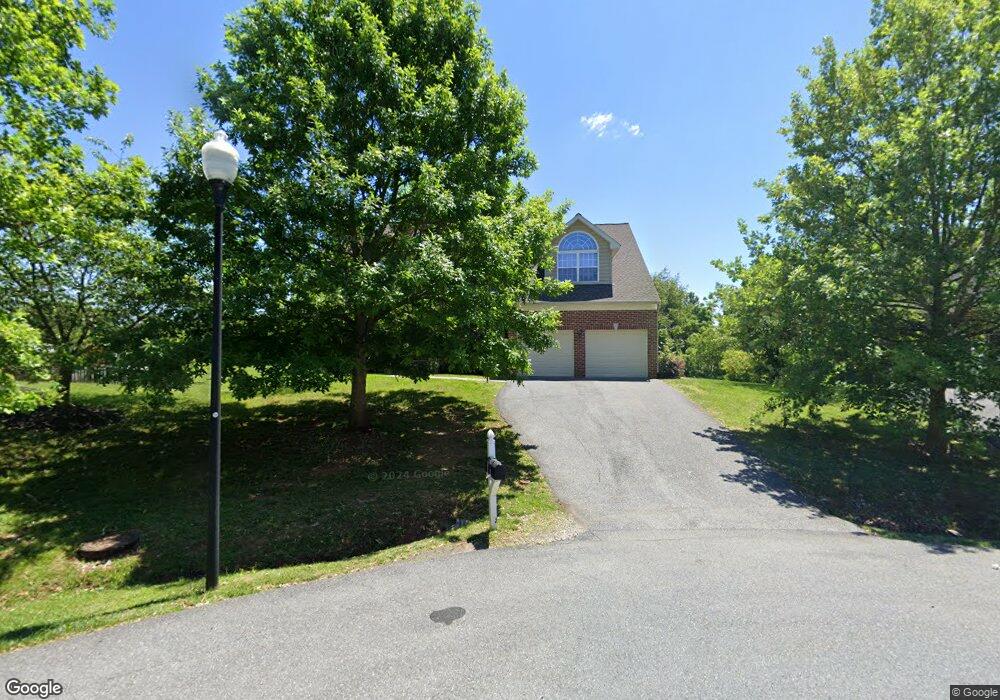
1701 Crommelins Ct Point of Rocks, MD 21777
Estimated Value: $663,000 - $712,000
--
Bed
5
Baths
3,282
Sq Ft
$212/Sq Ft
Est. Value
About This Home
This home is located at 1701 Crommelins Ct, Point of Rocks, MD 21777 and is currently estimated at $694,901, approximately $211 per square foot. 1701 Crommelins Ct is a home located in Frederick County with nearby schools including Valley Elementary School, Brunswick Middle School, and Brunswick High School.
Ownership History
Date
Name
Owned For
Owner Type
Purchase Details
Closed on
Oct 18, 2006
Sold by
Ausherman Homes Inc
Bought by
Okoye Ifeyinwa Enid
Current Estimated Value
Home Financials for this Owner
Home Financials are based on the most recent Mortgage that was taken out on this home.
Original Mortgage
$447,400
Outstanding Balance
$267,267
Interest Rate
6.48%
Mortgage Type
Purchase Money Mortgage
Estimated Equity
$427,634
Purchase Details
Closed on
Oct 12, 2006
Sold by
Ausherman Homes Inc
Bought by
Okoye Ifeyinwa Enid
Home Financials for this Owner
Home Financials are based on the most recent Mortgage that was taken out on this home.
Original Mortgage
$447,400
Outstanding Balance
$267,267
Interest Rate
6.48%
Mortgage Type
Purchase Money Mortgage
Estimated Equity
$427,634
Purchase Details
Closed on
May 16, 2006
Sold by
Pv I Llc
Bought by
Ausherman Homes Inc
Purchase Details
Closed on
May 12, 2006
Sold by
Pv I Llc
Bought by
Ausherman Homes Inc
Create a Home Valuation Report for This Property
The Home Valuation Report is an in-depth analysis detailing your home's value as well as a comparison with similar homes in the area
Home Values in the Area
Average Home Value in this Area
Purchase History
| Date | Buyer | Sale Price | Title Company |
|---|---|---|---|
| Okoye Ifeyinwa Enid | $559,275 | -- | |
| Okoye Ifeyinwa Enid | $559,275 | -- | |
| Ausherman Homes Inc | $120,545 | -- | |
| Ausherman Homes Inc | $120,545 | -- |
Source: Public Records
Mortgage History
| Date | Status | Borrower | Loan Amount |
|---|---|---|---|
| Open | Okoye Ifeyinwa Enid | $447,400 | |
| Closed | Okoye Ifeyinwa Enid | $447,400 |
Source: Public Records
Tax History Compared to Growth
Tax History
| Year | Tax Paid | Tax Assessment Tax Assessment Total Assessment is a certain percentage of the fair market value that is determined by local assessors to be the total taxable value of land and additions on the property. | Land | Improvement |
|---|---|---|---|---|
| 2025 | $6,442 | $585,433 | -- | -- |
| 2024 | $6,442 | $524,700 | $104,500 | $420,200 |
| 2023 | $5,873 | $498,133 | $0 | $0 |
| 2022 | $5,565 | $471,567 | $0 | $0 |
| 2021 | $5,229 | $445,000 | $104,500 | $340,500 |
| 2020 | $5,229 | $442,633 | $0 | $0 |
| 2019 | $5,201 | $440,267 | $0 | $0 |
| 2018 | $5,220 | $437,900 | $104,500 | $333,400 |
| 2017 | $5,050 | $437,900 | $0 | $0 |
| 2016 | $5,000 | $416,567 | $0 | $0 |
| 2015 | $5,000 | $405,900 | $0 | $0 |
| 2014 | $5,000 | $405,900 | $0 | $0 |
Source: Public Records
Map
Nearby Homes
- 1734 Fletchers Dr
- 2731 Tuscarora Rd
- 2734 Tuscarora Rd
- 42024 Brightwood Ln
- 2915 Fry Rd
- 41272 Yakey Ln
- 43084 Little Angel Ct
- 43080 Little Angel Ct
- 0 Mary Ln Unit VALO2078558
- 12235 Mary Ln
- 41073 Hickory Shade Ln
- 1261 New Design Rd
- 3230 Basford Rd
- 13232 Loyalty Rd
- 5510 Doubs Rd
- 2705 Bill Dorsey Blvd
- 2727 Bill Dorsey Blvd
- 00000 Mae Wade Ave
- 5504 Young Family Trail E
- 1607 Buckeystown Pike
- 1703 Crommelins Ct
- 1700 Crommelins Ct
- 1705 Crommelins Ct
- 1702 Canal Run Dr
- 1704 Canal Run Dr
- 1702 Crommelins Ct
- 1704 Crommelins Ct
- 1700 Canal Run Dr
- 1706 Canal Run Dr
- 1706 Crommelins Ct
- 3917 Red Leaf Ct
- 3805 Canal Run Ct
- 3918 Red Leaf Ct
- 1708 Canal Run Dr
- 1698 Canal Run Dr
- 3803 Canal Run Ct
- 1705 Canal Run Dr
- 1707 Canal Run Dr
- 3915 Red Leaf Ct
- 1613 Gibbons Rd