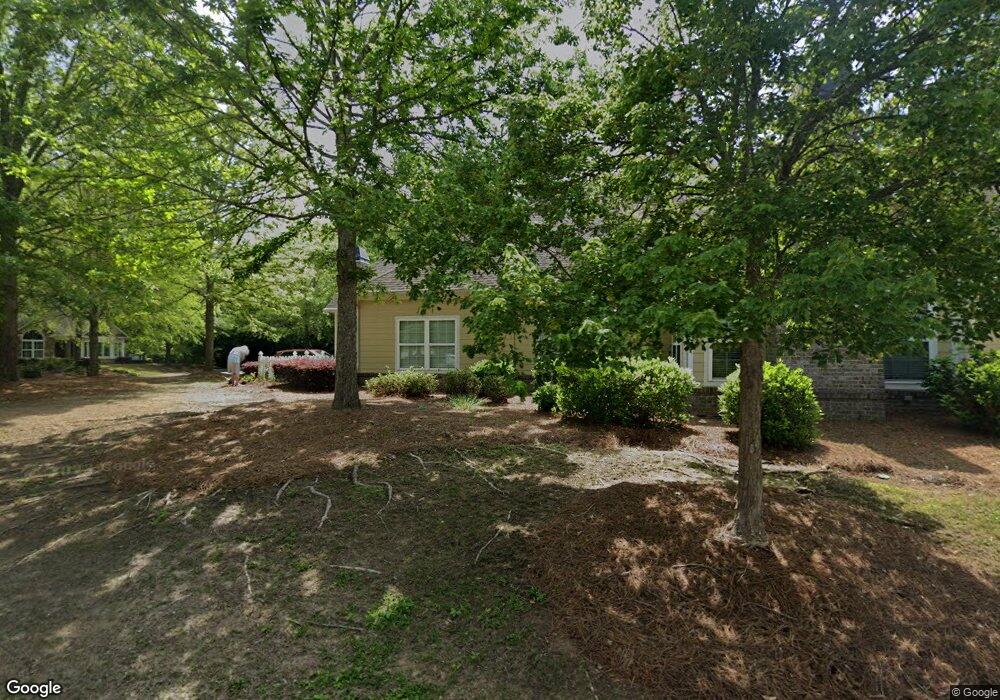
1701 Exchange Dr Macon, GA 31210
Estimated Value: $242,000 - $256,000
2
Beds
2
Baths
1,200
Sq Ft
$207/Sq Ft
Est. Value
About This Home
This home is located at 1701 Exchange Dr, Macon, GA 31210 and is currently estimated at $247,842, approximately $206 per square foot. 1701 Exchange Dr is a home located in Monroe County with nearby schools including T.G. Scott Elementary School, Mary Persons High School, and Academy for Classical Education.
Ownership History
Date
Name
Owned For
Owner Type
Purchase Details
Closed on
Aug 12, 2025
Sold by
Tucker John Edward
Bought by
Tucker Emma Christine
Current Estimated Value
Purchase Details
Closed on
May 17, 2022
Sold by
Murphy James K
Bought by
Tucker John and Tucker Emma C
Purchase Details
Closed on
Dec 18, 2015
Sold by
Thompson Marla J
Bought by
Murphy James K
Home Financials for this Owner
Home Financials are based on the most recent Mortgage that was taken out on this home.
Original Mortgage
$132,000
Interest Rate
3.98%
Mortgage Type
New Conventional
Purchase Details
Closed on
Jun 22, 2005
Sold by
Fairfield Financial Svcs I
Bought by
Waterford Development Partners
Purchase Details
Closed on
Jan 28, 2005
Bought by
Thompson Marla J
Home Financials for this Owner
Home Financials are based on the most recent Mortgage that was taken out on this home.
Original Mortgage
$111,440
Interest Rate
5.72%
Mortgage Type
New Conventional
Purchase Details
Closed on
Jan 31, 2003
Create a Home Valuation Report for This Property
The Home Valuation Report is an in-depth analysis detailing your home's value as well as a comparison with similar homes in the area
Purchase History
| Date | Buyer | Sale Price | Title Company |
|---|---|---|---|
| Tucker Emma Christine | -- | -- | |
| Tucker John | $199,500 | -- | |
| Murphy James K | $165,000 | -- | |
| Waterford Development Partners | -- | -- | |
| Thompson Marla J | $147,500 | -- | |
| Thompson Marla J | $147,440 | -- | |
| -- | -- | -- |
Source: Public Records
Mortgage History
| Date | Status | Borrower | Loan Amount |
|---|---|---|---|
| Previous Owner | Murphy James K | $132,000 | |
| Previous Owner | Thompson Marla J | $111,440 |
Source: Public Records
Tax History
| Year | Tax Paid | Tax Assessment Tax Assessment Total Assessment is a certain percentage of the fair market value that is determined by local assessors to be the total taxable value of land and additions on the property. | Land | Improvement |
|---|---|---|---|---|
| 2025 | $845 | $62,000 | $0 | $62,000 |
| 2024 | $845 | $78,200 | $0 | $78,200 |
| 2023 | $796 | $78,200 | $0 | $78,200 |
| 2022 | $1,135 | $78,200 | $0 | $78,200 |
| 2021 | $961 | $66,280 | $24,320 | $41,960 |
| 2020 | $985 | $66,280 | $24,320 | $41,960 |
| 2019 | $946 | $64,680 | $24,320 | $40,360 |
| 2018 | $949 | $64,680 | $24,320 | $40,360 |
| 2017 | $1,880 | $64,680 | $24,320 | $40,360 |
| 2016 | $903 | $64,680 | $24,320 | $40,360 |
| 2015 | $1,340 | $63,120 | $24,320 | $38,800 |
| 2014 | $1,293 | $63,120 | $24,320 | $38,800 |
Source: Public Records
Map
Nearby Homes
- 311 Arden Park Ln
- 261 Providence Blvd
- 1402 Cottage Hill Dr
- 328 Providence Blvd
- 332 Providence Blvd
- 340 Providence Blvd
- 376 Providence Blvd
- 135 Providence Blvd
- 726 Waverly Point
- 730 Waverly Point
- 605 Waverly Ct
- 609 Waverly Ct
- 120 Deer Ridge Trail
- 101 Westchester Dr
- 4265 Sheraton Dr
- 643 Millrun Ct
- 504 Edgefield Way
- 169 Brookefield Dr
- 309 Millwood Ct
- 405 Amberly Ct
- 1703 Exchange Dr
- 1702 Exchange Dr Unit 1702
- 1702 Cottage Ln
- 1704 Exchange Dr
- 1801 Exchange Dr
- 1802 Exchange Dr
- 201 Cottage Ln
- 1803 Exchange Dr
- 203 Cottage Ln
- 303 Cottage Ln
- 1804 Exchange Dr
- 301 Cottage Ln
- 1601 Cottage Hill Dr
- 1603 Exchange Dr
- 1604 Exchange Dr
- 202 Cottage Ln
- 204 Cottage Ln
- 302 Cottage Ln
- 1602 Cottage Hill Dr
- 1901 Exchange Dr
Your Personal Tour Guide
Ask me questions while you tour the home.