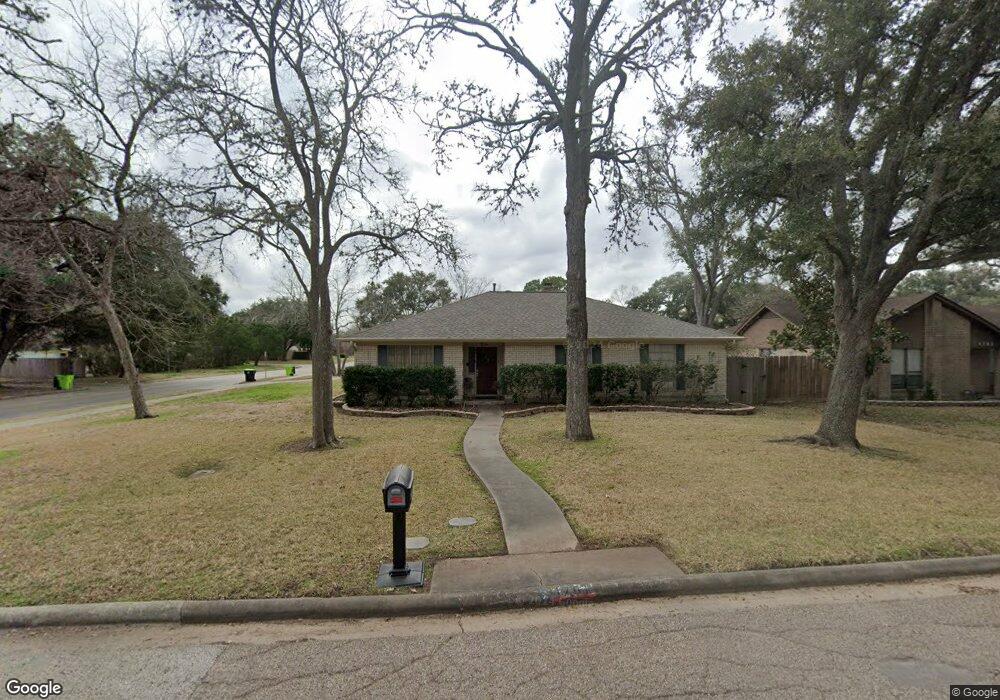
1701 Mulberry Dr Richmond, TX 77469
Estimated Value: $249,201 - $276,000
3
Beds
2
Baths
1,849
Sq Ft
$141/Sq Ft
Est. Value
About This Home
This home is located at 1701 Mulberry Dr, Richmond, TX 77469 and is currently estimated at $260,300, approximately $140 per square foot. 1701 Mulberry Dr is a home located in Fort Bend County with nearby schools including Smith Elementary School, J J Wessendorff Middle School, and Lamar Junior High School.
Ownership History
Date
Name
Owned For
Owner Type
Purchase Details
Closed on
Jul 18, 2016
Sold by
Casey Collin Southerland and Casey Emily Amanda
Bought by
Ford Wanda Morris
Current Estimated Value
Purchase Details
Closed on
May 20, 2002
Sold by
Sudholt Cathy A
Bought by
Casey Collin Southerland and Casey Emily Amanda
Home Financials for this Owner
Home Financials are based on the most recent Mortgage that was taken out on this home.
Original Mortgage
$87,000
Interest Rate
6.96%
Mortgage Type
Purchase Money Mortgage
Purchase Details
Closed on
Jul 27, 2001
Sold by
Johann Edward Wright and Johann Deborah Payne
Bought by
Sudholt Cathy A
Purchase Details
Closed on
Feb 1, 1994
Sold by
Lester Robert E and Lester Barbara
Bought by
Ford Wanda Morris
Create a Home Valuation Report for This Property
The Home Valuation Report is an in-depth analysis detailing your home's value as well as a comparison with similar homes in the area
Home Values in the Area
Average Home Value in this Area
Purchase History
| Date | Buyer | Sale Price | Title Company |
|---|---|---|---|
| Ford Wanda Morris | -- | Fort Bend Title Llc | |
| Casey Collin Southerland | -- | Chicago Title | |
| Ford Wanda Morris | -- | -- | |
| Sudholt Cathy A | -- | -- | |
| Ford Wanda Morris | -- | -- |
Source: Public Records
Mortgage History
| Date | Status | Borrower | Loan Amount |
|---|---|---|---|
| Previous Owner | Ford Wanda Morris | $87,000 |
Source: Public Records
Tax History Compared to Growth
Tax History
| Year | Tax Paid | Tax Assessment Tax Assessment Total Assessment is a certain percentage of the fair market value that is determined by local assessors to be the total taxable value of land and additions on the property. | Land | Improvement |
|---|---|---|---|---|
| 2025 | $1,823 | $225,863 | $30,550 | $195,313 |
| 2024 | $1,823 | $239,048 | $28,766 | $210,282 |
| 2023 | $1,662 | $217,316 | $0 | $234,048 |
| 2022 | $2,399 | $197,560 | $910 | $196,650 |
| 2021 | $4,265 | $179,600 | $23,500 | $156,100 |
| 2020 | $4,139 | $171,730 | $23,500 | $148,230 |
| 2019 | $4,372 | $171,180 | $23,500 | $147,680 |
| 2018 | $4,469 | $173,950 | $23,500 | $150,450 |
| 2017 | $4,283 | $164,800 | $20,000 | $144,800 |
| 2016 | $4,037 | $155,330 | $20,000 | $135,330 |
| 2015 | $3,336 | $145,380 | $20,000 | $125,380 |
| 2014 | $3,248 | $135,220 | $20,000 | $115,220 |
Source: Public Records
Map
Nearby Homes
- 1805 Hawthorn Dr
- 1809 Hawthorn Dr
- 1806 Cedar Dr
- 1922 Teakwood St
- 1004 Country Club Dr
- 1109 Frances Dr
- 4502 River Rd
- 0 Fm 2218 Unit 25550047
- 2015 Tanglelane St
- 805 Chateau Place
- 0 Meadow Ln
- 000 Fm 2218 Rd
- 2001 Briar Ln
- 512 and 514 Travis St
- 6303 Buffalo Bend Ln
- 400 Hillcrest Dr
- 406 Fairway Dr
- 1230 Law Ct
- The Royal (L481) Plan at Wall Street Village
- The Henderson (L404) Plan at Wall Street Village
- 1703 Mulberry Dr
- 1700 Hawthorn Dr
- 1709 Lamar Dr
- 1702 Hawthorn Dr
- 1705 Mulberry Dr
- 1700 Mulberry Dr
- 1705 Lamar Dr
- 1510 Hawthorn Dr
- 1702 Mulberry Dr
- 1704 Hawthorn Dr
- 1704 Mulberry Dr
- 1707 Mulberry Dr
- 1411 Evergreen Ct
- 1706 Hawthorn Dr
- 1706 Mulberry Dr
- 1506 Hawthorn Dr
- 1701 Hawthorn Dr
- 1701 Magnolia Ln
- 1709 Mulberry Dr
- 1409 Evergreen Ct