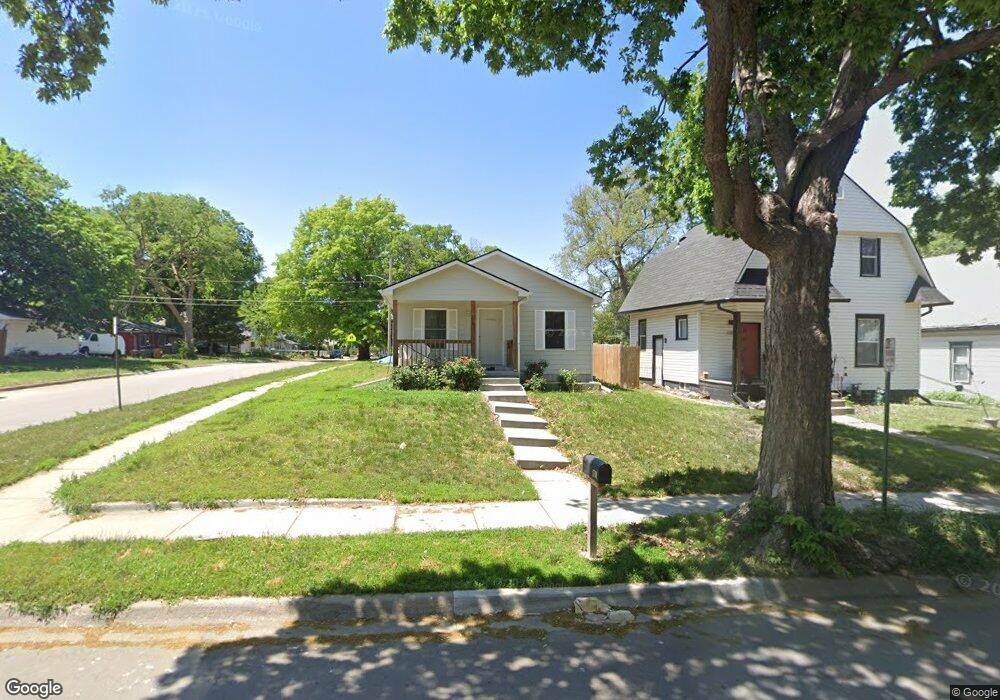
1701 N 31st St Lincoln, NE 68503
Clinton NeighborhoodEstimated Value: $228,000 - $252,000
3
Beds
4
Baths
1,140
Sq Ft
$212/Sq Ft
Est. Value
About This Home
This home is located at 1701 N 31st St, Lincoln, NE 68503 and is currently estimated at $241,383, approximately $211 per square foot. 1701 N 31st St is a home with nearby schools including Clinton Elementary School, C. Culler Middle School, and Lincoln Northeast High School.
Ownership History
Date
Name
Owned For
Owner Type
Purchase Details
Closed on
Apr 25, 2017
Sold by
Lincoln Lancaster County Habitat For Hum
Bought by
Ali Haider and Farhan Zaman
Current Estimated Value
Home Financials for this Owner
Home Financials are based on the most recent Mortgage that was taken out on this home.
Original Mortgage
$86,031
Outstanding Balance
$71,766
Interest Rate
4.3%
Mortgage Type
Unknown
Estimated Equity
$169,617
Purchase Details
Closed on
Apr 19, 2016
Sold by
Schultz Steven J and Schultz Rosemary
Bought by
Lincoln Lancaster County Habitat For Hum
Create a Home Valuation Report for This Property
The Home Valuation Report is an in-depth analysis detailing your home's value as well as a comparison with similar homes in the area
Home Values in the Area
Average Home Value in this Area
Purchase History
| Date | Buyer | Sale Price | Title Company |
|---|---|---|---|
| Ali Haider | $146,000 | Union Title Co Llc | |
| Lincoln Lancaster County Habitat For Hum | $20,000 | Union Title Company Llc |
Source: Public Records
Mortgage History
| Date | Status | Borrower | Loan Amount |
|---|---|---|---|
| Open | Ali Haider | $86,031 |
Source: Public Records
Tax History Compared to Growth
Tax History
| Year | Tax Paid | Tax Assessment Tax Assessment Total Assessment is a certain percentage of the fair market value that is determined by local assessors to be the total taxable value of land and additions on the property. | Land | Improvement |
|---|---|---|---|---|
| 2025 | $3,446 | $252,200 | $37,000 | $215,200 |
| 2024 | $3,446 | $246,500 | $30,000 | $216,500 |
| 2023 | $3,885 | $231,800 | $30,000 | $201,800 |
| 2022 | $3,803 | $190,800 | $25,000 | $165,800 |
| 2021 | $3,597 | $190,800 | $25,000 | $165,800 |
| 2020 | $3,424 | $179,200 | $25,000 | $154,200 |
| 2019 | $3,424 | $179,200 | $25,000 | $154,200 |
| 2018 | $2,188 | $114,000 | $25,000 | $89,000 |
| 2017 | $2,359 | $121,800 | $25,000 | $96,800 |
| 2016 | $518 | $26,600 | $25,000 | $1,600 |
| 2015 | $514 | $26,600 | $25,000 | $1,600 |
| 2014 | $539 | $27,700 | $25,000 | $2,700 |
| 2013 | -- | $27,700 | $25,000 | $2,700 |
Source: Public Records
Map
Nearby Homes