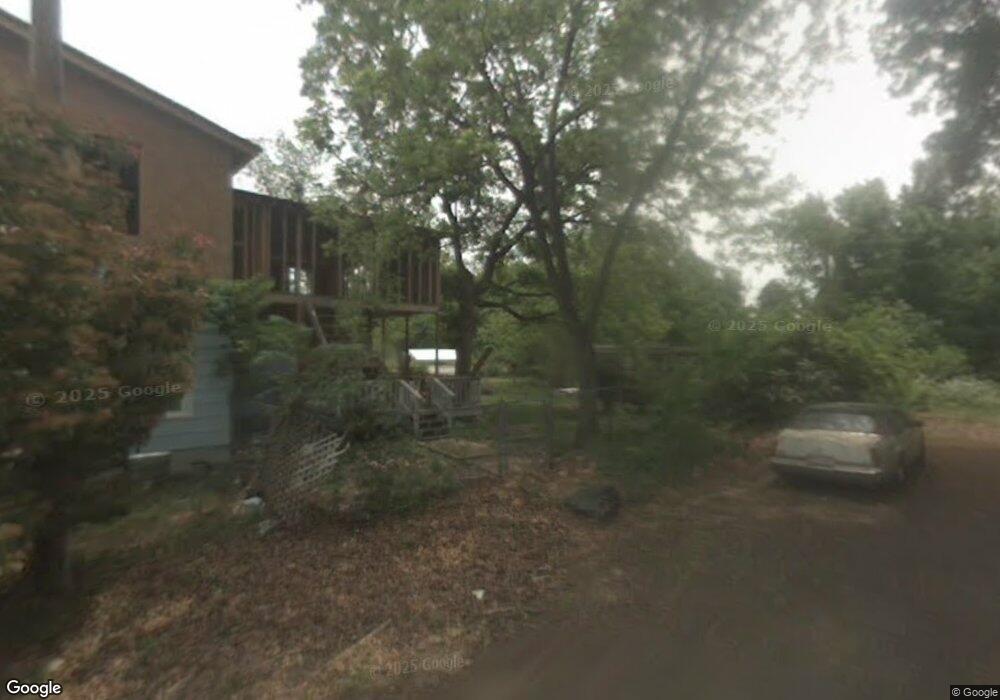
1701 N Lee St Salisbury, NC 28144
Estimated Value: $20,547 - $117,000
--
Bed
1
Bath
1,744
Sq Ft
$39/Sq Ft
Est. Value
About This Home
This home is located at 1701 N Lee St, Salisbury, NC 28144 and is currently estimated at $68,774, approximately $39 per square foot. 1701 N Lee St is a home located in Rowan County with nearby schools including Carroll T Overton Elementary School, Knox Middle School, and North Rowan Middle School.
Ownership History
Date
Name
Owned For
Owner Type
Purchase Details
Closed on
Mar 20, 2023
Sold by
Hill Geraldine Jones Eagle & Thomas Chri
Bought by
Hill Geraldine Jones Eagle
Current Estimated Value
Purchase Details
Closed on
Jun 21, 2017
Sold by
Adrian Marilyn Ann
Bought by
Rowan International Church
Purchase Details
Closed on
Jun 2, 2017
Sold by
Houston Robert F
Bought by
Adrian Marilyn Ann
Purchase Details
Closed on
Mar 24, 2006
Sold by
Hsbc Bank Usa
Bought by
Houston Robert F
Purchase Details
Closed on
Sep 20, 2005
Sold by
Harrison Alphonso
Bought by
Hsbc Bank Usa and Ace Securities Corp Home Equity Loan Tru
Create a Home Valuation Report for This Property
The Home Valuation Report is an in-depth analysis detailing your home's value as well as a comparison with similar homes in the area
Home Values in the Area
Average Home Value in this Area
Purchase History
| Date | Buyer | Sale Price | Title Company |
|---|---|---|---|
| Hill Geraldine Jones Eagle | -- | -- | |
| Hill Geraldine Jones Eagle | -- | None Listed On Document | |
| Rowan International Church | $9,000 | None Available | |
| Adrian Marilyn Ann | -- | None Available | |
| Houston Robert F | $52,000 | None Available | |
| Hsbc Bank Usa | $52,700 | -- |
Source: Public Records
Tax History Compared to Growth
Tax History
| Year | Tax Paid | Tax Assessment Tax Assessment Total Assessment is a certain percentage of the fair market value that is determined by local assessors to be the total taxable value of land and additions on the property. | Land | Improvement |
|---|---|---|---|---|
| 2025 | $217 | $18,113 | $17,713 | $400 |
| 2024 | $217 | $18,113 | $17,713 | $400 |
| 2023 | $217 | $18,113 | $17,713 | $400 |
| 2022 | $193 | $14,025 | $13,625 | $400 |
| 2021 | $193 | $14,025 | $13,625 | $400 |
| 2020 | $193 | $14,025 | $13,625 | $400 |
| 2019 | $193 | $14,025 | $13,625 | $400 |
| 2018 | $193 | $14,025 | $13,625 | $400 |
| 2017 | $190 | $14,025 | $13,625 | $400 |
| 2016 | $184 | $14,025 | $13,625 | $400 |
| 2015 | $185 | $14,025 | $13,625 | $400 |
| 2014 | $173 | $13,207 | $12,807 | $400 |
Source: Public Records
Map
Nearby Homes