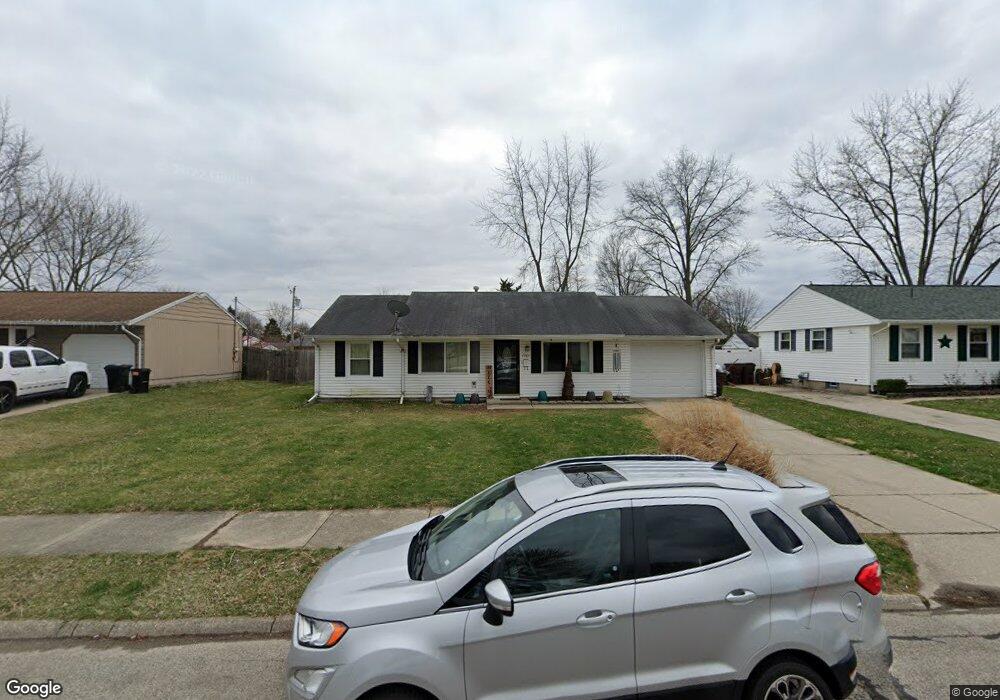
1701 Providence Ave Springfield, OH 45503
Estimated Value: $100,000 - $204,000
3
Beds
1
Bath
1,238
Sq Ft
$131/Sq Ft
Est. Value
About This Home
This home is located at 1701 Providence Ave, Springfield, OH 45503 and is currently estimated at $162,089, approximately $130 per square foot. 1701 Providence Ave is a home located in Clark County with nearby schools including Kenton Elementary School, Roosevelt Middle School, and Springfield High School.
Ownership History
Date
Name
Owned For
Owner Type
Purchase Details
Closed on
Jan 20, 2022
Sold by
Niclin Group Llc
Bought by
Apnj Properties Llc
Current Estimated Value
Purchase Details
Closed on
Nov 3, 2017
Sold by
Niclin Group Llc
Bought by
Apnj Properties Llc
Home Financials for this Owner
Home Financials are based on the most recent Mortgage that was taken out on this home.
Original Mortgage
$68,400
Interest Rate
5%
Mortgage Type
Land Contract Argmt. Of Sale
Purchase Details
Closed on
Oct 14, 2016
Sold by
Harris Crystal
Bought by
Niclin Group Llc
Purchase Details
Closed on
Dec 28, 2004
Sold by
Chu Eunice Chang
Bought by
Harris Paul and Harris Crystal
Home Financials for this Owner
Home Financials are based on the most recent Mortgage that was taken out on this home.
Original Mortgage
$72,400
Interest Rate
5.87%
Mortgage Type
Purchase Money Mortgage
Create a Home Valuation Report for This Property
The Home Valuation Report is an in-depth analysis detailing your home's value as well as a comparison with similar homes in the area
Home Values in the Area
Average Home Value in this Area
Purchase History
| Date | Buyer | Sale Price | Title Company |
|---|---|---|---|
| Apnj Properties Llc | $76,000 | Cole Acton Harmon Dunn | |
| Apnj Properties Llc | $76,000 | Team Title & Closing Service | |
| Niclin Group Llc | $53,000 | None Available | |
| Harris Paul | $90,500 | -- |
Source: Public Records
Mortgage History
| Date | Status | Borrower | Loan Amount |
|---|---|---|---|
| Previous Owner | Apnj Properties Llc | $68,400 | |
| Previous Owner | Harris Paul | $72,400 | |
| Closed | Harris Paul | $18,100 |
Source: Public Records
Tax History Compared to Growth
Tax History
| Year | Tax Paid | Tax Assessment Tax Assessment Total Assessment is a certain percentage of the fair market value that is determined by local assessors to be the total taxable value of land and additions on the property. | Land | Improvement |
|---|---|---|---|---|
| 2024 | $1,758 | $35,590 | $9,040 | $26,550 |
| 2023 | $1,758 | $35,590 | $9,040 | $26,550 |
| 2022 | $6,734 | $35,590 | $9,040 | $26,550 |
| 2021 | $1,774 | $32,290 | $6,800 | $25,490 |
| 2020 | $1,778 | $32,290 | $6,800 | $25,490 |
| 2019 | $1,783 | $32,290 | $6,800 | $25,490 |
| 2018 | $1,551 | $26,960 | $7,200 | $19,760 |
| 2017 | $1,550 | $28,249 | $7,203 | $21,046 |
| 2016 | $1,148 | $28,249 | $7,203 | $21,046 |
| 2015 | $961 | $27,843 | $6,797 | $21,046 |
| 2014 | $957 | $27,843 | $6,797 | $21,046 |
| 2013 | $947 | $27,843 | $6,797 | $21,046 |
Source: Public Records
Map
Nearby Homes
- 3129 Haverhill St
- 2907 Mystic Ln
- 1506 Hyannis Dr
- 1732 Falmouth Ave
- 1939 Providence Ave
- 3307 Tackett St
- 1225 Vester Ave
- 3214 Revels St
- 1811 Devon Dr
- 3231 Vineyard St
- 2022 Westboro Ave
- 3032 Armsgate Rd Unit 25
- 2933 Bahia Dr
- 2541 Derr Rd
- 2683 Home Orchard Dr
- 3316 Sudbury St
- 3046 Brixton Dr W Unit 173
- 2933 Stonehaven Dr
- 1148 Foxboro Rd
- 1920 Wedgewood Cir
- 1649 Providence Ave
- 1711 Providence Ave
- 1700 Marinette Dr
- 1708 Marinette Dr
- 1639 Providence Ave
- 1721 Providence Ave
- 1716 Marinette Dr
- 3035 Woonsocket St
- 1638 Marinette Dr
- 1631 Providence Ave
- 1731 Providence Ave
- 1722 Providence Ave
- 3036 Sturbridge St
- 1724 Marinette Dr
- 1630 Marinette Dr
- 3111 Woonsocket St
- 1741 Providence Ave
- 1623 Providence Ave
- 3112 Woonsocket St
- 1732 Marinette Dr