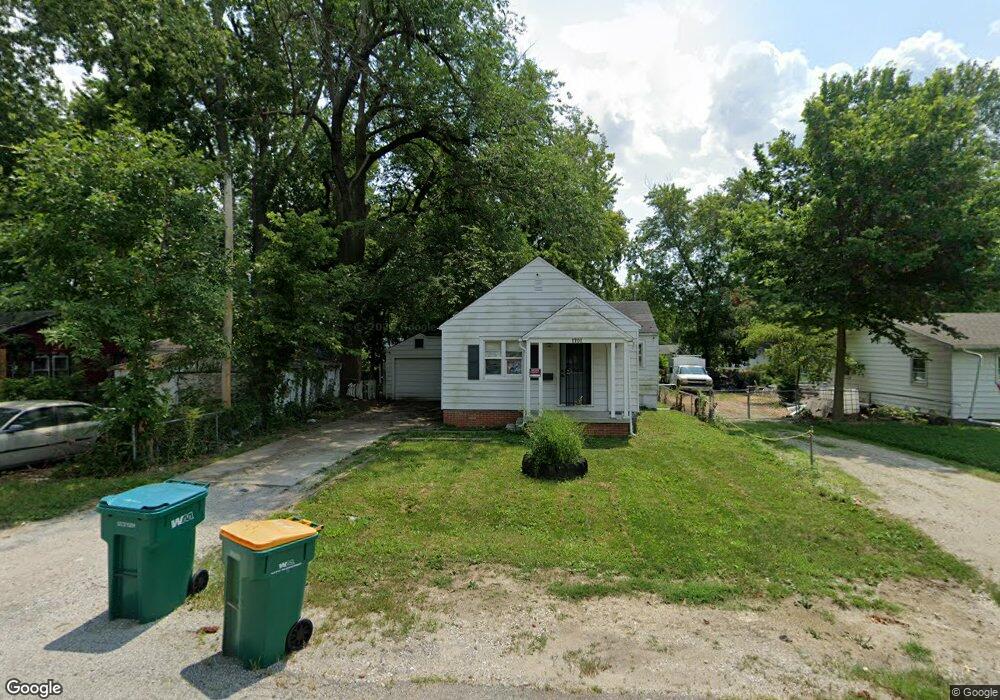
1701 W Center St Decatur, IL 62526
Ravina Park NeighborhoodEstimated Value: $50,184 - $78,000
3
Beds
1
Bath
1,404
Sq Ft
$46/Sq Ft
Est. Value
About This Home
This home is located at 1701 W Center St, Decatur, IL 62526 and is currently estimated at $65,046, approximately $46 per square foot. 1701 W Center St is a home located in Macon County with nearby schools including Stephen Decatur Middle School and Northwest Christian Campus.
Ownership History
Date
Name
Owned For
Owner Type
Purchase Details
Closed on
Oct 13, 2021
Sold by
Circuit Court Clerk
Bought by
Bt Prop/Vermilion County Llc
Current Estimated Value
Purchase Details
Closed on
Oct 15, 2015
Sold by
Beasley Edward E
Bought by
Mullinax Brandon W
Home Financials for this Owner
Home Financials are based on the most recent Mortgage that was taken out on this home.
Original Mortgage
$13,000
Interest Rate
3.88%
Mortgage Type
Purchase Money Mortgage
Purchase Details
Closed on
Mar 9, 2007
Sold by
Drew Denise R
Bought by
Beasley Edward E and Certain Trust
Purchase Details
Closed on
May 31, 2006
Sold by
Regions Bank
Bought by
Drew Dennis R
Home Financials for this Owner
Home Financials are based on the most recent Mortgage that was taken out on this home.
Original Mortgage
$19,200
Interest Rate
6.62%
Mortgage Type
Future Advance Clause Open End Mortgage
Purchase Details
Closed on
Nov 3, 2005
Sold by
Williams Cheryl Ann and Cleveland Harvey
Bought by
Union Planters Bank Na
Purchase Details
Closed on
Jul 1, 1994
Create a Home Valuation Report for This Property
The Home Valuation Report is an in-depth analysis detailing your home's value as well as a comparison with similar homes in the area
Home Values in the Area
Average Home Value in this Area
Purchase History
| Date | Buyer | Sale Price | Title Company |
|---|---|---|---|
| Bt Prop/Vermilion County Llc | -- | None Listed On Document | |
| Mullinax Brandon W | $7,500 | None Available | |
| Beasley Edward E | $45,000 | None Available | |
| Drew Dennis R | $24,000 | None Available | |
| Union Planters Bank Na | -- | None Available | |
| -- | $31,000 | -- |
Source: Public Records
Mortgage History
| Date | Status | Borrower | Loan Amount |
|---|---|---|---|
| Previous Owner | Mullinax Brandon W | $13,000 | |
| Previous Owner | Drew Dennis R | $19,200 |
Source: Public Records
Tax History Compared to Growth
Tax History
| Year | Tax Paid | Tax Assessment Tax Assessment Total Assessment is a certain percentage of the fair market value that is determined by local assessors to be the total taxable value of land and additions on the property. | Land | Improvement |
|---|---|---|---|---|
| 2024 | $1,189 | $12,280 | $1,622 | $10,658 |
| 2023 | $1,179 | $11,846 | $1,565 | $10,281 |
| 2022 | $952 | $9,312 | $1,449 | $7,863 |
| 2021 | $895 | $8,696 | $1,353 | $7,343 |
| 2020 | $882 | $8,292 | $1,290 | $7,002 |
| 2019 | $882 | $8,292 | $1,290 | $7,002 |
| 2018 | $1,270 | $12,085 | $1,754 | $10,331 |
| 2017 | $1,300 | $12,408 | $1,801 | $10,607 |
| 2016 | $1,324 | $12,534 | $1,819 | $10,715 |
| 2015 | $1,259 | $12,313 | $1,787 | $10,526 |
| 2014 | $593 | $12,191 | $1,769 | $10,422 |
| 2013 | $635 | $12,648 | $1,835 | $10,813 |
Source: Public Records
Map
Nearby Homes
- 1415 N Dennis Ave
- 1675 W Center St
- 1645 W Center St
- 1524 N Summit Ave
- 1706 W Division St
- 1530 W Cushing St
- 1535 N Mcclellan Ave
- 1319 W Waggoner St
- 2192 W Waggoner St
- 1625 W Garfield Ave
- 2195 W Center St
- 2209 W Center St
- 1451 W Marietta St
- 2125 Clearmont Ave
- 2201 W Packard St
- 2231 W Packard St
- 2121 Barding Ave
- 0 Valley View Place
- 917 N Wilder Ave
- 2131 N Oakcrest Ct
- 1719 W Center St
- 1435 N Dennis Ave
- 1455 N Dennis Ave
- 1700 W Waggoner St
- 1821 W Center St
- 1830 W Waggoner St
- 1425 N Dennis Ave
- 1823 W Center St
- 1850 W Waggoner St
- 1710 W Center St
- 1714 W Center St
- 1405 N Dennis Ave
- 1720 W Center St
- 1503 N Dennis Ave
- 1870 W Waggoner St
- 1509 N Dennis Ave
- 1804 W Center St
- 1879 W Center St
- 1876 W Center St
- 1890 W Waggoner St