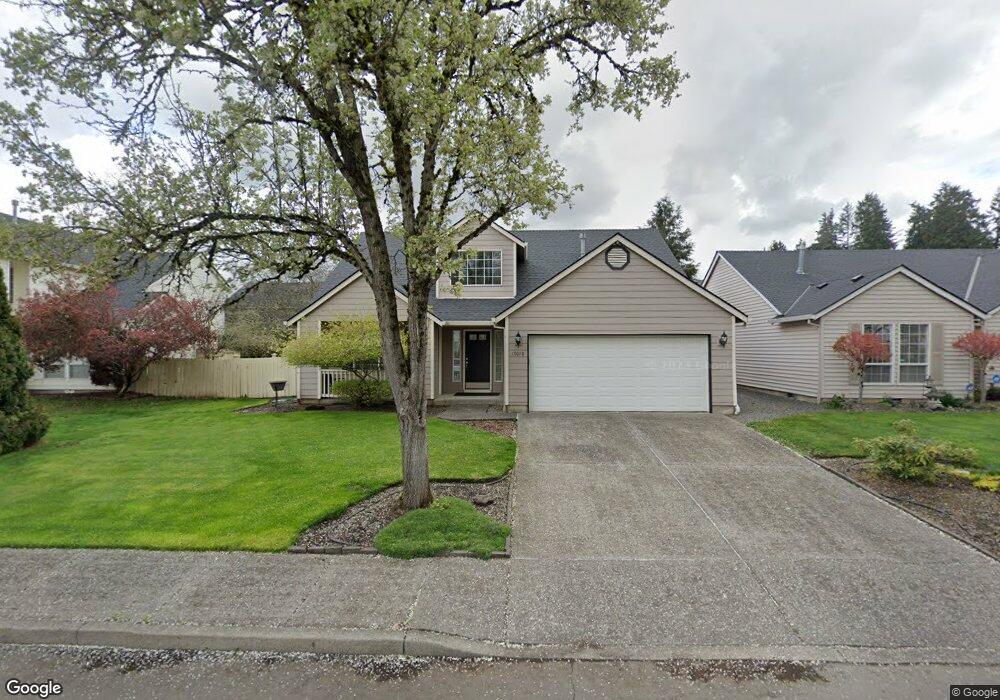
17010 SE 28th St Vancouver, WA 98683
Fisher's Landing East NeighborhoodEstimated Value: $586,000 - $598,000
4
Beds
2
Baths
1,941
Sq Ft
$304/Sq Ft
Est. Value
About This Home
This home is located at 17010 SE 28th St, Vancouver, WA 98683 and is currently estimated at $589,766, approximately $303 per square foot. 17010 SE 28th St is a home located in Clark County with nearby schools including Columbia Valley Elementary School, Shahala Middle School, and Mountain View High School.
Ownership History
Date
Name
Owned For
Owner Type
Purchase Details
Closed on
Feb 22, 2000
Sold by
Micjan Ronald L
Bought by
Sletten Ronald L and Sletten Charlene S
Current Estimated Value
Home Financials for this Owner
Home Financials are based on the most recent Mortgage that was taken out on this home.
Original Mortgage
$109,000
Outstanding Balance
$36,032
Interest Rate
8.16%
Estimated Equity
$553,734
Purchase Details
Closed on
Jul 1, 1998
Sold by
Rauth Jill R and Lenz Jill R
Bought by
Micjan Ronald L
Home Financials for this Owner
Home Financials are based on the most recent Mortgage that was taken out on this home.
Original Mortgage
$125,200
Interest Rate
7.06%
Purchase Details
Closed on
Nov 9, 1995
Sold by
Lenz Thomas S
Bought by
Rauth Jill R and Lenz Jill R
Home Financials for this Owner
Home Financials are based on the most recent Mortgage that was taken out on this home.
Original Mortgage
$143,000
Interest Rate
7.58%
Create a Home Valuation Report for This Property
The Home Valuation Report is an in-depth analysis detailing your home's value as well as a comparison with similar homes in the area
Home Values in the Area
Average Home Value in this Area
Purchase History
| Date | Buyer | Sale Price | Title Company |
|---|---|---|---|
| Sletten Ronald L | $165,500 | Chicago Title Insurance Co | |
| Micjan Ronald L | $156,500 | First American Title Ins Co | |
| Rauth Jill R | -- | First American Title Co |
Source: Public Records
Mortgage History
| Date | Status | Borrower | Loan Amount |
|---|---|---|---|
| Open | Sletten Ronald L | $109,000 | |
| Previous Owner | Micjan Ronald L | $125,200 | |
| Previous Owner | Rauth Jill R | $143,000 |
Source: Public Records
Tax History Compared to Growth
Tax History
| Year | Tax Paid | Tax Assessment Tax Assessment Total Assessment is a certain percentage of the fair market value that is determined by local assessors to be the total taxable value of land and additions on the property. | Land | Improvement |
|---|---|---|---|---|
| 2025 | $5,034 | $529,271 | $210,000 | $319,271 |
| 2024 | $4,969 | $507,497 | $210,000 | $297,497 |
| 2023 | $4,799 | $519,752 | $210,000 | $309,752 |
| 2022 | $4,280 | $495,961 | $199,500 | $296,461 |
| 2021 | $4,223 | $419,458 | $168,000 | $251,458 |
| 2020 | $3,908 | $391,127 | $157,500 | $233,627 |
| 2019 | $3,502 | $365,359 | $150,000 | $215,359 |
| 2018 | $4,072 | $352,608 | $0 | $0 |
| 2017 | $3,511 | $329,575 | $0 | $0 |
| 2016 | $3,407 | $294,275 | $0 | $0 |
| 2015 | $3,396 | $273,387 | $0 | $0 |
| 2014 | -- | $260,520 | $0 | $0 |
| 2013 | -- | $223,017 | $0 | $0 |
Source: Public Records
Map
Nearby Homes
- 17005 SE 27th St
- 17200 SE 26th Dr Unit N52
- 2501 SE 175th Ave
- 3113 SE 169th Ct
- 16802 SE 32nd St
- 17146 SE 23rd Dr Unit 68
- 17146 SE 23rd Dr Unit 20
- 16909 SE 34th Way
- 16807 SE 35th Cir
- 1819 SE 173rd Ave
- 17203 SE Fisher Dr
- 17619 SE 35th St
- 17402 SE 18th St
- 17420 SE 18th St
- 3708 SE 167th Ct
- 15907 SE 29th St
- 3612 SE 165th Ave
- 17004 SE 16th St
- 17311 SE 15th Way Unit 80
- 17401 SE 39th St Unit 7
- 17008 SE 28th St
- 17012 SE 28th St
- 17007 SE 27th St
- 17009 SE 27th St
- 17006 SE 28th St
- 17014 SE 28th St
- 17011 SE 28th St
- 17009 SE 28th St
- 17103 SE 27th St
- 17003 SE 27th St
- 17013 SE 28th St
- 17007 SE 28th St
- 17004 SE 28th St
- 17001 SE 27th St
- 17005 SE 28th St
- 17015 SE 28th St
- 2606 SE 171st Ct
- 17002 SE 28th St
- 17006 SE 27th St
- 17004 SE 27th St