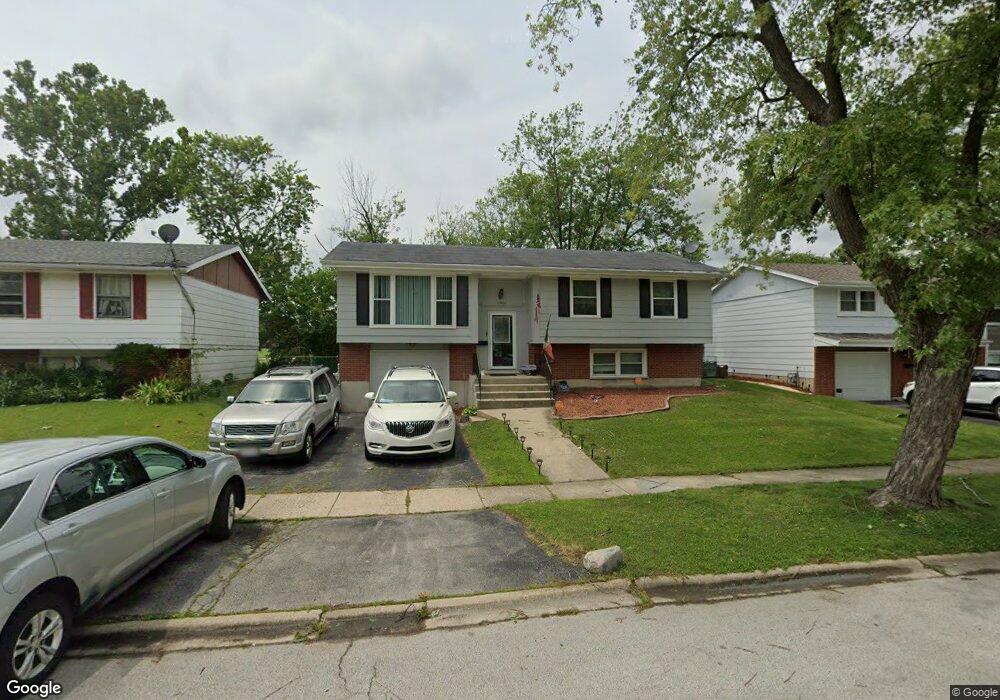
17014 Elm Dr Hazel Crest, IL 60429
Estimated Value: $208,434 - $243,000
3
Beds
2
Baths
1,150
Sq Ft
$196/Sq Ft
Est. Value
About This Home
This home is located at 17014 Elm Dr, Hazel Crest, IL 60429 and is currently estimated at $225,609, approximately $196 per square foot. 17014 Elm Dr is a home located in Cook County with nearby schools including Highlands Elementary School, Prairie-Hills Junior High School, and Hillcrest High School.
Ownership History
Date
Name
Owned For
Owner Type
Purchase Details
Closed on
Aug 13, 2025
Sold by
Rodriguez Marisa
Bought by
Rodriguez Marisa and Torres Jose A
Current Estimated Value
Purchase Details
Closed on
Jul 20, 2017
Sold by
Jb Rei Properties Llc
Bought by
Rodriguez Marisa
Home Financials for this Owner
Home Financials are based on the most recent Mortgage that was taken out on this home.
Original Mortgage
$147,283
Interest Rate
3.87%
Mortgage Type
FHA
Purchase Details
Closed on
Feb 7, 2017
Sold by
Federal Home Loan Mortgage Corporation
Bought by
Jb Rei Properties Llc
Purchase Details
Closed on
Aug 22, 2016
Sold by
Richardson William and Richardson William M
Bought by
Federal Home Loan Mortgage Corporation
Purchase Details
Closed on
Apr 16, 2006
Sold by
Richardson Elizabeth
Bought by
Richardson William
Create a Home Valuation Report for This Property
The Home Valuation Report is an in-depth analysis detailing your home's value as well as a comparison with similar homes in the area
Home Values in the Area
Average Home Value in this Area
Purchase History
| Date | Buyer | Sale Price | Title Company |
|---|---|---|---|
| Rodriguez Marisa | -- | None Listed On Document | |
| Rodriguez Marisa | $150,000 | Attorneys Title Guaranty Fun | |
| Jb Rei Properties Llc | $35,000 | Attorneys Title Guaranty Fun | |
| Federal Home Loan Mortgage Corporation | -- | Attorney | |
| Richardson William | -- | None Available |
Source: Public Records
Mortgage History
| Date | Status | Borrower | Loan Amount |
|---|---|---|---|
| Previous Owner | Rodriguez Marisa | $147,283 |
Source: Public Records
Tax History
| Year | Tax Paid | Tax Assessment Tax Assessment Total Assessment is a certain percentage of the fair market value that is determined by local assessors to be the total taxable value of land and additions on the property. | Land | Improvement |
|---|---|---|---|---|
| 2025 | $7,010 | $17,000 | $2,340 | $14,660 |
| 2024 | $7,010 | $17,000 | $2,340 | $14,660 |
| 2023 | $4,297 | $17,000 | $2,340 | $14,660 |
| 2022 | $4,297 | $9,274 | $1,980 | $7,294 |
| 2021 | $4,205 | $9,273 | $1,980 | $7,293 |
| 2020 | $4,145 | $9,273 | $1,980 | $7,293 |
| 2019 | $3,911 | $9,270 | $1,800 | $7,470 |
| 2018 | $3,786 | $9,270 | $1,800 | $7,470 |
| 2017 | $5,619 | $9,270 | $1,800 | $7,470 |
| 2016 | $4,352 | $7,444 | $1,620 | $5,824 |
| 2015 | $4,169 | $7,444 | $1,620 | $5,824 |
| 2014 | $4,067 | $7,444 | $1,620 | $5,824 |
| 2013 | $4,262 | $8,900 | $1,620 | $7,280 |
Source: Public Records
Map
Nearby Homes
- 17007 Elm Dr
- 3321 Tulip Dr
- 3318 Tulip Dr
- 3319 Tulip Dr
- 3312 Maple Ln
- 3425 Birchwood Dr
- 3316 Birchwood Dr
- 17113 Elm Dr
- 3511 Laurel Ln
- 3509 Birchwood Dr
- 3214 Birchwood Dr
- 17206 Elm Dr
- 17000 Magnolia Dr
- 3213 Woodworth Place
- 3321 173rd St
- 17306 Burr Oak Ln
- 17213 Springtide Ln
- 3311 Hickory Ln
- 17316 Central Park Ave
- 17005 Albany Ave Unit 102
Your Personal Tour Guide
Ask me questions while you tour the home.