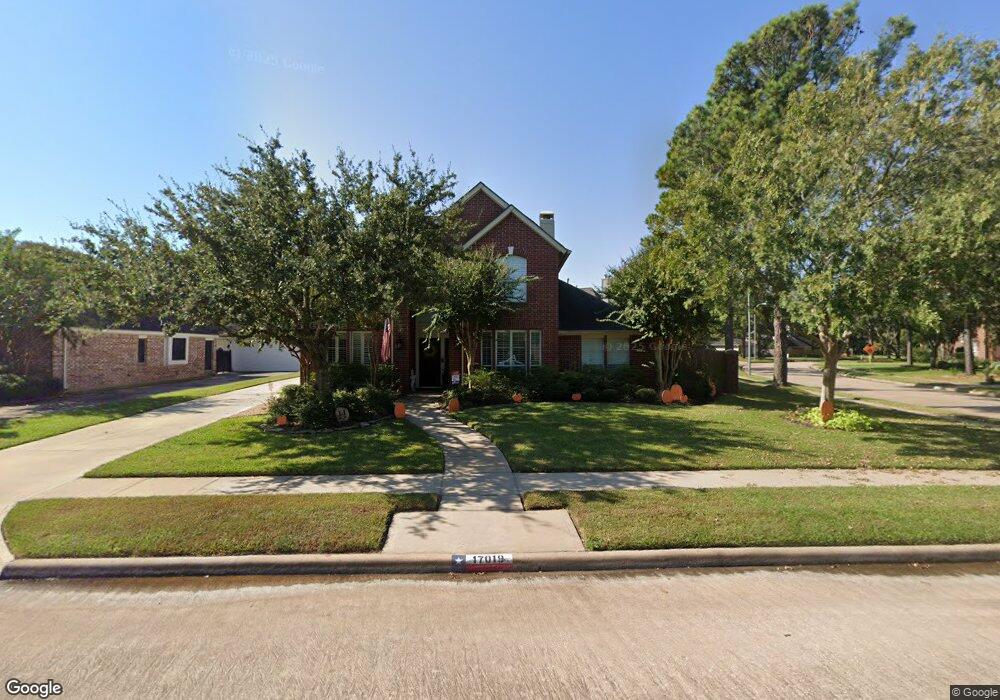
17019 Calm Lagoon Ct Houston, TX 77095
Copper Lakes NeighborhoodEstimated Value: $394,000 - $452,000
4
Beds
3
Baths
3,166
Sq Ft
$135/Sq Ft
Est. Value
About This Home
This home is located at 17019 Calm Lagoon Ct, Houston, TX 77095 and is currently estimated at $426,197, approximately $134 per square foot. 17019 Calm Lagoon Ct is a home located in Harris County with nearby schools including Copeland Elementary School, Aragon Middle School, and Langham Creek High School.
Ownership History
Date
Name
Owned For
Owner Type
Purchase Details
Closed on
Aug 13, 2021
Sold by
Ostendorf Diana F
Bought by
Ostendorf Diana F and Haag Steven E
Current Estimated Value
Purchase Details
Closed on
Jul 16, 2007
Sold by
Ostendorf Gregory C and Ostendorf Diana F
Bought by
Ostendorf Diana F
Purchase Details
Closed on
Sep 2, 1997
Sold by
Todd Douglas C and Todd Leigh Ann G
Bought by
Ostendorf Gregory C and Ostendorf Diana F
Home Financials for this Owner
Home Financials are based on the most recent Mortgage that was taken out on this home.
Original Mortgage
$149,600
Outstanding Balance
$23,204
Interest Rate
7.48%
Estimated Equity
$402,993
Purchase Details
Closed on
Jul 31, 1995
Sold by
Weekley Homes Inc
Bought by
Todd Douglas C and Todd Leigh Ann G
Home Financials for this Owner
Home Financials are based on the most recent Mortgage that was taken out on this home.
Original Mortgage
$158,550
Interest Rate
7.51%
Create a Home Valuation Report for This Property
The Home Valuation Report is an in-depth analysis detailing your home's value as well as a comparison with similar homes in the area
Home Values in the Area
Average Home Value in this Area
Purchase History
| Date | Buyer | Sale Price | Title Company |
|---|---|---|---|
| Ostendorf Diana F | -- | None Available | |
| Ostendorf Diana F | -- | First American | |
| Ostendorf Gregory C | -- | First American Title | |
| Todd Douglas C | -- | Priority Title |
Source: Public Records
Mortgage History
| Date | Status | Borrower | Loan Amount |
|---|---|---|---|
| Open | Ostendorf Gregory C | $149,600 | |
| Previous Owner | Todd Douglas C | $158,550 |
Source: Public Records
Tax History Compared to Growth
Tax History
| Year | Tax Paid | Tax Assessment Tax Assessment Total Assessment is a certain percentage of the fair market value that is determined by local assessors to be the total taxable value of land and additions on the property. | Land | Improvement |
|---|---|---|---|---|
| 2025 | -- | $377,000 | $82,900 | $294,100 |
| 2024 | -- | $372,503 | $82,900 | $289,603 |
| 2023 | $5,704 | $396,114 | $82,900 | $313,214 |
| 2022 | $8,772 | $364,068 | $59,158 | $304,910 |
| 2021 | $8,004 | $305,276 | $59,158 | $246,118 |
| 2020 | $7,500 | $283,102 | $45,536 | $237,566 |
| 2019 | $7,701 | $282,000 | $45,536 | $236,464 |
| 2018 | $2,779 | $272,525 | $45,536 | $226,989 |
| 2017 | $7,566 | $272,525 | $45,536 | $226,989 |
| 2016 | $7,746 | $279,000 | $45,536 | $233,464 |
| 2015 | $3,849 | $295,003 | $45,536 | $249,467 |
| 2014 | $3,849 | $261,997 | $45,536 | $216,461 |
Source: Public Records
Map
Nearby Homes
- 17310 Crescent Canyon Dr
- 7807 Hickory Mill Ct
- 7626 Almond Springs Dr
- 17518 Rustling Aspen Ln
- 7810 Timberline Run Ln
- 17710 Noble Oak Ct
- 8410 Castle Pond Ct
- 17214 Palm Falls Ct
- 17603 Fairgrove Park Dr
- 17010 Poplar Hill St
- 8411 Sandestine Ct
- 7539 Wildwood Brook Ct
- 17814 Stoney Glade Ct
- 17326 Masonridge Dr
- 8519 Sunrise Meadow Ln
- 8507 Forest Arbor Ct
- 17522 Masonridge Dr
- 17222 Crown Meadow Ct
- 16535 Oat Mill Dr
- 7614 Mccormick Mill Ct
- 17015 Calm Lagoon Ct
- 17026 Laguna Springs Dr
- 17011 Calm Lagoon Ct
- 17022 Laguna Springs Dr
- 8019 E Copper Lakes Dr
- 17018 Calm Lagoon Ct
- 17018 Laguna Springs Dr
- 8015 E Copper Lakes Dr
- 17014 Calm Lagoon Ct
- 8023 E Copper Lakes Dr
- 17007 Calm Lagoon Ct
- 17010 Calm Lagoon Ct
- 17014 Laguna Springs Dr
- 8011 E Copper Lakes Dr
- 17007 Highland Canyon Dr
- 17006 Calm Lagoon Ct
- 8011 Laguna Springs Ct
- 17010 Laguna Springs Dr
- 8107 E Copper Lakes Dr
- 17027 Preston Springs Dr